In this article we will use GDB debugger to trace the internals of Postgres and observe how an input query passes through several levels of transformation (Parser -> Analyzer -> Rewriter -> Planner -> Executor) and eventually produces an output.
This article is based on PG12 running on Ubuntu 18.04, and we will use a simple SELECT query with ORDER BY , GROUP BY, and LIMIT keywords to go through the entire query processing tracing.
2. Preparation
GDB debugger is required to be installed to trace the internals of Postgres. Most recent distribution of Linux already comes with gdb pre-installed. If you do not have it, please install.
2.1 Enable Debugging and Disable Compiler Optimization on PG Build
For GDB to be useful, the postgres binaries have to be compiled with debugging symbols enabled (-g). In addition, I would suggest to turn off compiler optimization (-O0) such that while tracing we will be able to examine all memory blocks and values, and observe the execution flow properly.
Enable debugging using the ./configure utility in the Postgres source code repository
cd [PG_SOURCE_DIR]
./configure --enable-debug
This will add the (-g) parameter to the CFLAGS in the main Makefile to include debugging symbols.
Once finished, let’s disable compiler optimization by editing
src/Makefile.global
Find the line where CFLAGS is defined and changed -O2 to -O0 like this:
Then we need to build and install with the new Makefile
make
sudo make install
2.2 Initialize Postgres Server
For a new build, we will need to initialize a new database
initDb /home/caryh/postgresql
create user caryh
createdb carytest
For referencing purposes, I would suggest enable debug log for the Postgres server by modifying postgres.conf located in database home directory. In this case it is located in
/home/caryh/postgresql/postgres.conf
Enable the following lines in postgres.conf
postgres.conf
log_destination = 'syslog'
syslog_facility = 'LOCAL0'
syslog_ident = 'postgres'
syslog_sequence_numbers = on
syslog_split_messages = on

debug_print_parse = on
debug_print_rewritten = on
debug_print_plan = on
debug_pretty_print = on
log_checkpoints = on
log_connections = on
log_disconnections = on
log_duration = on
Why do we enable debug log when we will be tracing postgres with gdb? This is because the output at some of the stages of query processing is represented as a complex list of structures and it is not very straightforward to print this structure unless we have written a third party print script that can help us recursively print the content of the complex structure. Postgres already has this function built-in and presented in the form of a debugging log.
2.3 Start Postgres Server and Connect with Client Tool
sudo gdb /usr/local/pgsql/bin/postgres GNU gdb (Ubuntu 8.1-0ubuntu3) 8.1.0.20180409-git Copyright (C) 2018 Free Software Foundation, Inc. License GPLv3+: GNU GPL version 3 or later <http://gnu.org/licenses/gpl.html> This is free software: you are free to change and redistribute it. There is NO WARRANTY, to the extent permitted by law. Type "show copying" and "show warranty"for details. This GDB was configured as "x86_64-linux-gnu". Type "show configuration"for configuration details. For bug reporting instructions, please see: <http://www.gnu.org/software/gdb/bugs/>. Find the GDB manual and other documentation resources online at: <http://www.gnu.org/software/gdb/documentation/>. For help, type"help". Type "apropos word" to search for commands related to "word"... Reading symbols from /usr/local/pgsql/bin/postgres...done. (gdb)
Now, we can attach gdb to the PID identified in previous step
(gdb) attach 7082
Attaching to program: /usr/local/pgsql/bin/postgres, process 7082
Reading symbols from /lib/x86_64-linux-gnu/libpthread.so.0...Reading symbols from /usr/lib/debug/.build-id/28/c6aade70b2d40d1f0f3d0a1a0cad1ab816448f.debug...done.
done.
[Thread debugging using libthread_db enabled]
Using host libthread_db library "/lib/x86_64-linux-gnu/libthread_db.so.1".
Reading symbols from /lib/x86_64-linux-gnu/librt.so.1...Reading symbols from /usr/lib/debug//lib/x86_64-linux-gnu/librt-2.27.so...done.
done.
Reading symbols from /lib/x86_64-linux-gnu/libdl.so.2...Reading symbols from /usr/lib/debug//lib/x86_64-linux-gnu/libdl-2.27.so...done.
done.
Reading symbols from /lib/x86_64-linux-gnu/libm.so.6...Reading symbols from /usr/lib/debug//lib/x86_64-linux-gnu/libm-2.27.so...done.
done.
Reading symbols from /lib/x86_64-linux-gnu/libc.so.6...Reading symbols from /usr/lib/debug//lib/x86_64-linux-gnu/libc-2.27.so...done.
done.
Reading symbols from /lib64/ld-linux-x86-64.so.2...Reading symbols from /usr/lib/debug//lib/x86_64-linux-gnu/ld-2.27.so...done.
done.
Reading symbols from /lib/x86_64-linux-gnu/libnss_files.so.2...Reading symbols from /usr/lib/debug//lib/x86_64-linux-gnu/libnss_files-2.27.so...done.
done.
0x00007fce71eafb77 in epoll_wait (epfd=4, events=0x5633194c87e0, maxevents=1, timeout=-1)
    at ../sysdeps/unix/sysv/linux/epoll_wait.c:30
30  ../sysdeps/unix/sysv/linux/epoll_wait.c: No such file or directory.
(gdb)
Upon attach, Postgres process will be put on a break and we are able to issue breakpoints command from here
4. Start Tracing with gdb
exec_simple_query is the function that will trigger all stages of query processing. Let’s put a breakpoint here.
(gdb) b exec_simple_query
Breakpoint 1 at 0x56331899a43b: file postgres.c, line 985.
(gdb) c
Continuing.
Now, let’s type in a SELECT query with ORDER BY keywords on the postgres client connection terminal to trigger break point
carytest=> select serial_number, count(serial_number) from devicedata GROUP BY serial_number ORDER BY count DESC LIMIT 2;
Breakpoint should be triggered
Breakpoint 1, exec_simple_query (
    query_string=0x56331949cf00 "select * from devicedata order by serial_number desc;") at postgres.c:985
(gdb)
Let’s do a backtrace bt command to see how the control got here.
(gdb) bt
#0  exec_simple_query (query_string=0x56331949cf00 "select * from devicedata order by serial_number desc;") at postgres.c:985
#1  0x000056331899f01c in PostgresMain (argc=1, argv=0x5633194c89c8, dbname=0x5633194c8890 "carytest", username=0x5633194c8878 "cary") at postgres.c:4249
#2  0x00005633188fba97 in BackendRun (port=0x5633194c0f60) at postmaster.c:4431
#3  0x00005633188fb1ba in BackendStartup (port=0x5633194c0f60) at postmaster.c:4122
#4  0x00005633188f753e in ServerLoop () at postmaster.c:1704
#5  0x00005633188f6cd4 in PostmasterMain (argc=3, argv=0x5633194974c0) at postmaster.c:1377
#6  0x000056331881a10f in main (argc=3, argv=0x5633194974c0) at main.c:228
As you can see, PostmasterMain process is one of the early process to be started and this is where it will spawn all the backend processes and initialize the ‘ServerLoop’ to listen for client connections. When a client connets and issues some queries, the handle will be passed from the backend to PostgresMain and this is where the query processing will begine.
5. Parser Stage
Parser Stage is the first stage in query processing, which will take an input query string and produce a raw un-analyzed parse tree. The control will eventually come to the raw_parser function, so let’s set a break point there and do a backtrace:
(gdb)  b raw_parser
Breakpoint 2 at 0x5633186b5bae: file parser.c, line 37.
(gdb)  c
Continuing.

Breakpoint 2, raw_parser (str=0x56331949cf00 "select * from devicedata order by serial_number desc;") at parser.c:37

(gdb) bt
#0  raw_parser (str=0x56331949cf00 "select * from devicedata order by serial_number desc;") at parser.c:37
#1  0x000056331899a03e in pg_parse_query ( query_string=0x56331949cf00 "select * from devicedata order by serial_number desc;") at postgres.c:641
#2  0x000056331899a4c9 in exec_simple_query ( query_string=0x56331949cf00 "select * from devicedata order by serial_number desc;") at postgres.c:1037
#3  0x000056331899f01c in PostgresMain (argc=1, argv=0x5633194c89c8, dbname=0x5633194c8890 "carytest",  username=0x5633194c8878 "cary") at postgres.c:4249
#4  0x00005633188fba97 in BackendRun (port=0x5633194c0f60) at postmaster.c:4431
#5  0x00005633188fb1ba in BackendStartup (port=0x5633194c0f60) at postmaster.c:4122
#6  0x00005633188f753e in ServerLoop () at postmaster.c:1704
#7  0x00005633188f6cd4 in PostmasterMain (argc=3, argv=0x5633194974c0) at postmaster.c:1377
#8  0x000056331881a10f in main (argc=3, argv=0x5633194974c0) at main.c:228
In raw_parser, 2 things will happen, first to scan the query with flex-based scanner to check keyword validity and second to do the actual parsing with bison-based parser. In the end, it will return a parse tree for next stage.
(gdb) n
43    yyscanner = scanner_init(str, &yyextra.core_yy_extra,
(gdb) n
47    yyextra.have_lookahead = false;
(gdb) n
50    parser_init(&yyextra);
(gdb)
53    yyresult = base_yyparse(yyscanner);
(gdb)
56    scanner_finish(yyscanner);
(gdb)
58    if (yyresult)       /* error */
(gdb)
61    return yyextra.parsetree;
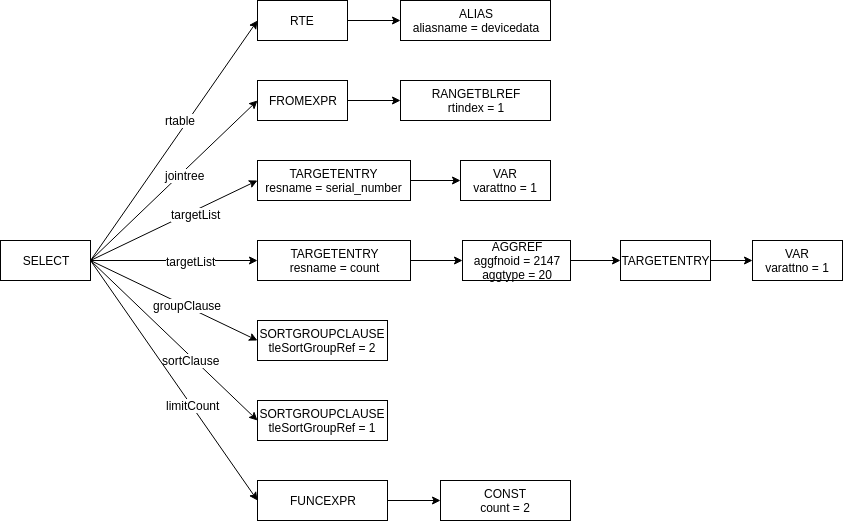
It is not very straight-forward to examine the content of the parse tree stored in yyextra.parsetree as above. This is why we enabled postgres debug log so that we can utilize it to recursively print the content of the parse tree. The parse tree illustrated by yyextra.parsetree can be visualized as this image below:
6.0 Analyzer Stage
Now we have a list of parse trees, size 1 in this example, PG will need to feed each item in the list into anaylzer and rewriter functions. Let’s set a break point at parse_analyze function
(gdb)  b parse_analyze
Breakpoint 3 at 0x56331867d608: file analyze.c, line 104.
(gdb) c
Continuing.

Breakpoint 3, parse_analyze (parseTree=0x56331949dd50,  sourceText=0x56331949cf00 "select * from devicedata order by serial_number desc;", paramTypes=0x0, numParams=0, queryEnv=0x0) at analyze.c:104
104   ParseState *pstate = make_parsestate(NULL);
(gdb) bt

#0  parse_analyze (parseTree=0x56331949dd50, sourceText=0x56331949cf00 "select * from devicedata order by serial_number desc;", paramTypes=0x0, numParams=0, queryEnv=0x0) at analyze.c:104
#1  0x000056331899a0a8 in pg_analyze_and_rewrite (parsetree=0x56331949dd50,
    query_string=0x56331949cf00 "select * from devicedata order by serial_number desc;",
    paramTypes=0x0, numParams=0, queryEnv=0x0) at postgres.c:695
#2  0x000056331899a702 in exec_simple_query (
    query_string=0x56331949cf00 "select * from devicedata order by serial_number desc;")
    at postgres.c:1140
#3  0x000056331899f01c in PostgresMain (argc=1, argv=0x5633194c89c8,
    dbname=0x5633194c8890 "carytest", username=0x5633194c8878 "cary") at postgres.c:4249
#4  0x00005633188fba97 in BackendRun (port=0x5633194c0f60) at postmaster.c:4431
#5  0x00005633188fb1ba in BackendStartup (port=0x5633194c0f60) at postmaster.c:4122
#6  0x00005633188f753e in ServerLoop () at postmaster.c:1704
#7  0x00005633188f6cd4 in PostmasterMain (argc=3, argv=0x5633194974c0) at postmaster.c:1377
#8  0x000056331881a10f in main (argc=3, argv=0x5633194974c0) at main.c:228
The above backtrace shows how the control gets to parse_analyze function, and 2 vital imputs are parseTree (type RawStmt) and (const char) sourceText
At analyzer stage, it produces a result of type Query and it is in fact the data type return from the parser stage as a List of Query. This structure will be fed into the rewriter stage.
7.0 Rewriter Stage
Rewriter is the next stage following analyzer, let’s create a break point at pg_rewrite_query and do a backtrace:
(gdb) b pg_rewrite_query
Breakpoint 4 at 0x56331899a1c1: file postgres.c, line 773
(gdb) c
Continuing.

Breakpoint 4, pg_rewrite_query (query=0x56331949dee0) at postgres.c:773
773   if (Debug_print_parse)
(gdb) bt
#0  pg_rewrite_query (query=0x56331949dee0) at postgres.c:773
#1  0x000056331899a0cf in pg_analyze_and_rewrite (parsetree=0x56331949dd50,
    query_string=0x56331949cf00 "select * from devicedata order by serial_number desc;",
    paramTypes=0x0, numParams=0, queryEnv=0x0) at postgres.c:704
#2  0x000056331899a702 in exec_simple_query (
    query_string=0x56331949cf00 "select * from devicedata order by serial_number desc;")
    at postgres.c:1140
#3  0x000056331899f01c in PostgresMain (argc=1, argv=0x5633194c89c8,
    dbname=0x5633194c8890 "carytest", username=0x5633194c8878 "cary") at postgres.c:4249
#4  0x00005633188fba97 in BackendRun (port=0x5633194c0f60) at postmaster.c:4431
#5  0x00005633188fb1ba in BackendStartup (port=0x5633194c0f60) at postmaster.c:4122
#6  0x00005633188f753e in ServerLoop () at postmaster.c:1704
#7  0x00005633188f6cd4 in PostmasterMain (argc=3, argv=0x5633194974c0) at postmaster.c:1377
#8  0x000056331881a10f in main (argc=3, argv=0x5633194974c0) at main.c:228
(gdb)
Rewriter takes the output of the previou stage and returns a querytree_list of type List*. Let’s trace the function to the end and print the output
773     if (Debug_print_parse)
(gdb) n
774     elog_node_display(LOG, "parse tree", query,
(gdb)
777   if (log_parser_stats)
(gdb)
780   if (query->commandType == CMD_UTILITY)
(gdb)
788     querytree_list = QueryRewrite(query);
(gdb)
791   if (log_parser_stats)
(gdb)
848   if (Debug_print_rewritten)
(gdb)
849     elog_node_display(LOG, "rewritten parse tree", querytree_list,
(gdb)
852   return querytree_list;
the line 774 elog_node_display and line 849 elog_node_display are the debug print function provided by postgres to recursively print the content of Query before and after rewriter stage. After examining the output query tree, we found that in this example, the rewriter does not make much modification to the origianl query tree and it can be visualized as:
8.0 Planner Stage
Planner is the next stage immediately following the previous. The main planner function entry point is pg_plan_query and it takes the output from previous stage as input. Let’s create a breakpoint and do a backtrace again
(gdb) b pg_plan_queries
Breakpoint 5 at 0x56331899a32d: file postgres.c, line 948.
(gdb) c
Continuing.

Breakpoint 5, pg_plan_queries (querytrees=0x563319558558, cursorOptions=256, boundParams=0x0)
    at postgres.c:948
948   List     *stmt_list = NIL;
(gdb) bt
#0  pg_plan_queries (querytrees=0x563319558558, cursorOptions=256, boundParams=0x0) at postgres.c:948
#1  0x000056331899a722 in exec_simple_query ( query_string=0x56331949cf00 "select * from devicedata order by serial_number desc;") at postgres.c:1143
#2  0x000056331899f01c in PostgresMain (argc=1, argv=0x5633194c89c8, dbname=0x5633194c8890 "carytest", username=0x5633194c8878 "cary") at postgres.c:4249
#3  0x00005633188fba97 in BackendRun (port=0x5633194c0f60) at postmaster.c:4431
#4  0x00005633188fb1ba in BackendStartup (port=0x5633194c0f60) at postmaster.c:4122
#5  0x00005633188f753e in ServerLoop () at postmaster.c:1704
#6  0x00005633188f6cd4 in PostmasterMain (argc=3, argv=0x5633194974c0) at postmaster.c:1377
#7  0x000056331881a10f in main (argc=3, argv=0x5633194974c0) at main.c:228
(gdb)
Now, we are here, let’s trace the function until the end. Please note that for each content block in the input querytree list, the function will call a helper plan function called pg_plan_query and it will perform the real plan operation there and return the result in plannedStmt data type
(gdb) n
951   foreach(query_list, querytrees)
(gdb) n
953     Query    *query = lfirst_node(Query, query_list);
(gdb) n
956     if (query->commandType == CMD_UTILITY)
(gdb) n
968       stmt = pg_plan_query(query, cursorOptions, boundParams);
(gdb) s
pg_plan_query (querytree=0x56331949dee0, cursorOptions=256, boundParams=0x0) at postgres.c:866
866   if (querytree->commandType == CMD_UTILITY)
(gdb) n
874   if (log_planner_stats)
(gdb)
878   plan = planner(querytree, cursorOptions, boundParams);
(gdb) n
880   if (log_planner_stats)
(gdb)
929   if (Debug_print_plan)
(gdb)
930     elog_node_display(LOG, "plan", plan, Debug_pretty_print);
(gdb)
934   return plan;
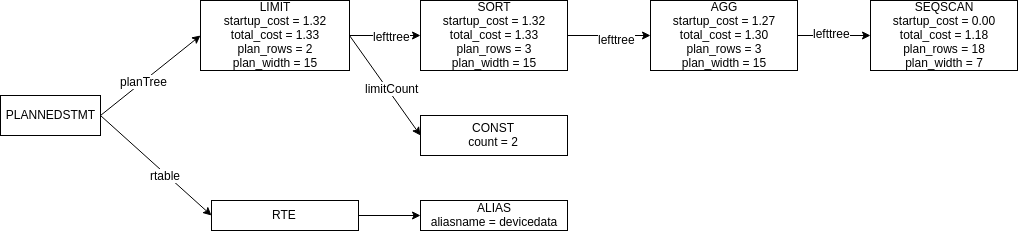
Line 930 elog_node_display will print the content of PlannedStmt recursively to syslog and it can be visualized as:
The above plan tree corresponds to the output of EXPLAIN ANALYZE on the same query.
carytest=> EXPLAIN ANALYZE SELECT serial_number, COUNT(serial_number) from devicedata GROUP BY serial_number ORDER BY count DESC LIMIT 2;
                                                       QUERY PLAN

------------------------------------------------------------------------------------
 Limit  (cost=1.32..1.33 rows=2 width=15) (actual time=0.043..0.044 rows=2 loops=1)
   ->  Sort  (cost=1.32..1.33 rows=3 width=15) (actual time=0.042..0.042 rows=2 loops=1)
         Sort Key: (count(serial_number)) DESC
         Sort Method: quicksort  Memory: 25kB
         ->  HashAggregate  (cost=1.27..1.30 rows=3 width=15) (actual time=0.033..0.035 rows=3
 loops=1)
               Group Key: serial_number
               ->  Seq Scan on devicedata  (cost=0.00..1.18 rows=18 width=7) (actual time=0.01
3..0.016 rows=18 loops=1)
 Planning Time: 28.541 ms
 Execution Time: 0.097 ms
(9 rows)
Line 878 plan = planner(querytree, cursorOptions, boundParams); in the above trace is the real planner logic and it is a complex stage. Inside this function, it will compute the initial cost and run time cost of all possible queries and in the end, it will choose a plan that is the least expensive.
with the plannedStmt produced, we are ready to enter the next stage of query processing.
9.0 Executor Stage
In addition to planner, executor is also one of the complex stages of query processing. This module is responsible for executing the query plan produced from previous stage and sending the query results back to the connecting client.
Executor is invoked and managed with a wrapper called portal and portal is an object representing the execution state of a query and providing memory management services but it does not actually run the executor. In the end, the portal will invoke one of the four executor routines as below
Before we can use the above routines, the portal needs to be initialized first. In the previous stage, the control is left at exec_simple_query at line 1147, let’s continue tracing from here to enter portal initialization
Let’s create a break point for each executor routine and do a back trace on each as we continue
(gdb) b ExecutorStart
Breakpoint 6 at 0x5633187ad797: file execMain.c, line 146.
(gdb) b ExecutorRun
Breakpoint 7 at 0x5633187ada1e: file execMain.c, line 306.
(gdb) b ExecutorFinish
Breakpoint 8 at 0x5633187adc35: file execMain.c, line 405.
(gdb) b ExecutorEnd
Breakpoint 9 at 0x5633187add1e: file execMain.c, line 465.
9.1 Executor Start
The main purpose of ExecutorStart routine is to prepare the query plan, allocate storage and prepare rule manager. Let’s continue the tracing and do a backtrace.
Breakpoint 6, ExecutorStart (queryDesc=0x5633195712e0, eflags=0) at execMain.c:146
146   if (ExecutorStart_hook)
(gdb) bt
#0  ExecutorStart (queryDesc=0x564977500190, eflags=0) at execMain.c:146
#1  0x0000564975eb87e0 in PortalStart (portal=0x5649774a18d0, params=0x0, eflags=0, snapshot=0x0)
    at pquery.c:518
#2  0x0000564975eb27b5 in exec_simple_query (
    query_string=0x564977439f00 "select serial_number, count(serial_number) from devicedata GROUP BY serial_number ORDER BY count DESC LIMIT 2;") at postgres.c:1176
#3  0x0000564975eb701c in PostgresMain (argc=1, argv=0x564977465a08,
    dbname=0x5649774658d0 "carytest", username=0x5649774658b8 "cary") at postgres.c:4249
#4  0x0000564975e13a97 in BackendRun (port=0x56497745dfa0) at postmaster.c:4431
#5  0x0000564975e131ba in BackendStartup (port=0x56497745dfa0) at postmaster.c:4122
#6  0x0000564975e0f53e in ServerLoop () at postmaster.c:1704
#7  0x0000564975e0ecd4 in PostmasterMain (argc=3, argv=0x5649774344c0) at postmaster.c:1377
#8  0x0000564975d3210f in main (argc=3, argv=0x5649774344c0) at main.c:228

(gdb)
9.2 Executor Run
ExecutorRun is the main routine of executor module, and its main task is to execute the query plan, this routing will call the ExecutePlan function to actually execute the plan. In the end, before return, the result of query will be stored in Estate structure called estate and inside there is a count of how many tutples have been processed by the executor
(gdb) c
Continuing.

Breakpoint 7, ExecutorRun (queryDesc=0x5633195712e0, direction=ForwardScanDirection, count=0,
    execute_once=true) at execMain.c:306
306   if (ExecutorRun_hook)
(gdb) bt
#0  ExecutorRun (queryDesc=0x564977500190, direction=ForwardScanDirection, count=0,
    execute_once=true) at execMain.c:306
#1  0x0000564975eb915c in PortalRunSelect (portal=0x5649774a18d0, forward=true, count=0,
    dest=0x564977539460) at pquery.c:929
#2  0x0000564975eb8db6 in PortalRun (portal=0x5649774a18d0, count=9223372036854775807,
    isTopLevel=true, run_once=true, dest=0x564977539460, altdest=0x564977539460,
    completionTag=0x7ffff0b937d0 "") at pquery.c:770
#3  0x0000564975eb28ad in exec_simple_query (
    query_string=0x564977439f00 "select serial_number, count(serial_number) from devicedata GROUP BY serial_number ORDER BY count DESC LIMIT 2;") at postgres.c:1215
#4  0x0000564975eb701c in PostgresMain (argc=1, argv=0x564977465a08,
    dbname=0x5649774658d0 "carytest", username=0x5649774658b8 "cary") at postgres.c:4249
#5  0x0000564975e13a97 in BackendRun (port=0x56497745dfa0) at postmaster.c:4431
#6  0x0000564975e131ba in BackendStartup (port=0x56497745dfa0) at postmaster.c:4122
#7  0x0000564975e0f53e in ServerLoop () at postmaster.c:1704
#8  0x0000564975e0ecd4 in PostmasterMain (argc=3, argv=0x5649774344c0) at postmaster.c:1377
#9  0x0000564975d3210f in main (argc=3, argv=0x5649774344c0) at main.c:228
(gdb)
Continue tracing the ExecutorRun to the end.
306   if (ExecutorRun_hook)
(gdb) n
309     standard_ExecutorRun(queryDesc, direction, count, execute_once);
(gdb) s
standard_ExecutorRun (queryDesc=0x564977500190, direction=ForwardScanDirection, count=0,
    execute_once=true) at execMain.c:325
325   estate = queryDesc->estate;
(gdb) n
333   oldcontext = MemoryContextSwitchTo(estate->es_query_cxt);
(gdb) n
336   if (queryDesc->totaltime)
(gdb) n
342   operation = queryDesc->operation;
(gdb)
343   dest = queryDesc->dest;
(gdb)
348   estate->es_processed = 0;
(gdb)
350   sendTuples = (operation == CMD_SELECT ||
(gdb)
353   if (sendTuples)
(gdb)
354     dest->rStartup(dest, operation, queryDesc->tupDesc);
(gdb)
359   if (!ScanDirectionIsNoMovement(direction))
(gdb)
361     if (execute_once && queryDesc->already_executed)
(gdb)
363     queryDesc->already_executed = true;
(gdb)
365     ExecutePlan(estate,
(gdb)
367           queryDesc->plannedstmt->parallelModeNeeded,
(gdb)
365     ExecutePlan(estate,
(gdb)
379   if (sendTuples)
(gdb)
380     dest->rShutdown(dest);
(gdb)
382   if (queryDesc->totaltime)
(gdb)
385   MemoryContextSwitchTo(oldcontext);
(gdb) p estate
$6 = (EState *) 0x56497751fbb0
(gdb) p estate->es_processed
$7 = 2
9.3 Executor Finish
ExecutorFinish must be called after the last ExecutorRun, its main task is to perform necessary clearn up actions and also fire up after Triggers. Let’s trace a little further.
(gdb) c
Continuing.

Breakpoint 8, ExecutorFinish (queryDesc=0x5633195712e0) at execMain.c:405
405   if (ExecutorFinish_hook)
(gdb) bt
#0  ExecutorFinish (queryDesc=0x564977500190) at execMain.c:405
#1  0x0000564975c5b52c in PortalCleanup (portal=0x5649774a18d0) at portalcmds.c:300
#2  0x0000564976071ba4 in PortalDrop (portal=0x5649774a18d0, isTopCommit=false) at portalmem.c:499
#3  0x0000564975eb28d3 in exec_simple_query (
    query_string=0x564977439f00 "select serial_number, count(serial_number) from devicedata GROUP BY serial_number ORDER BY count DESC LIMIT 2;") at postgres.c:1225
#4  0x0000564975eb701c in PostgresMain (argc=1, argv=0x564977465a08,
    dbname=0x5649774658d0 "carytest", username=0x5649774658b8 "cary") at postgres.c:4249
#5  0x0000564975e13a97 in BackendRun (port=0x56497745dfa0) at postmaster.c:4431
#6  0x0000564975e131ba in BackendStartup (port=0x56497745dfa0) at postmaster.c:4122
#7  0x0000564975e0f53e in ServerLoop () at postmaster.c:1704
#8  0x0000564975e0ecd4 in PostmasterMain (argc=3, argv=0x5649774344c0) at postmaster.c:1377
#9  0x0000564975d3210f in main (argc=3, argv=0x5649774344c0) at main.c:228
Continue tracing the ExecutorFinish to the end.
405   if (ExecutorFinish_hook)
(gdb) n
408     standard_ExecutorFinish(queryDesc);
(gdb) s
standard_ExecutorFinish (queryDesc=0x564977500190) at execMain.c:420
420   estate = queryDesc->estate;
(gdb) n
429   oldcontext = MemoryContextSwitchTo(estate->es_query_cxt);
(gdb)
432   if (queryDesc->totaltime)
(gdb)
436   ExecPostprocessPlan(estate);
(gdb)
439   if (!(estate->es_top_eflags & EXEC_FLAG_SKIP_TRIGGERS))
(gdb)
442   if (queryDesc->totaltime)
(gdb)
445   MemoryContextSwitchTo(oldcontext);
(gdb)
447   estate->es_finished = true;
(gdb)
448 }
9.4 Executor End
This routing basically resets and releases some of the state variables in QueryDesc used during execution. ExecutorEnd is the last routine to be called and before entry, the PortalCleanup and PortalDrop are invoked first. So as we are in this routine the outer Portal object is also performing the cleanup process.
Breakpoint 9, ExecutorEnd (queryDesc=0x5633195712e0) at execMain.c:465 465 if (ExecutorEnd_hook) (gdb) bt #0 ExecutorEnd (queryDesc=0x564977500190) at execMain.c:465 #1 0x0000564975c5b538 in PortalCleanup (portal=0x5649774a18d0) at portalcmds.c:301 #2 0x0000564976071ba4 in PortalDrop (portal=0x5649774a18d0, isTopCommit=false) at portalmem.c:499 #3 0x0000564975eb28d3 in exec_simple_query ( query_string=0x564977439f00 "select serial_number, count(serial_number) from devicedata GROUP BY serial_number ORDER BY count DESC LIMIT 2;") at postgres.c:1225 #4 0x0000564975eb701c in PostgresMain (argc=1, argv=0x564977465a08, dbname=0x5649774658d0 "carytest", username=0x5649774658b8 "cary") at postgres.c:4249 #5 0x0000564975e13a97 in BackendRun (port=0x56497745dfa0) at postmaster.c:4431 #6 0x0000564975e131ba in BackendStartup (port=0x56497745dfa0) at postmaster.c:4122 #7 0x0000564975e0f53e in ServerLoop () at postmaster.c:1704 #8 0x0000564975e0ecd4 in PostmasterMain (argc=3, argv=0x5649774344c0) at postmaster.c:1377 #9 0x0000564975d3210f in main (argc=3, argv=0x5649774344c0) at main.c:228
This routine marks the end of the query processing stages, the control will be passed back to exec_simple_query to finish the transaction and present result back to the client.
10.0 Presenting the Result Back to Client
With the transaction ended, the send_ready_for_query flag will be set, and the control is now able to enter ReadyForQuery to present the result to client.
(gdb) b ReadyForQuery
Breakpoint 10 at 0x56331899811d: file dest.c, line 251.
(gdb) c
Continuing.

Breakpoint 10, ReadyForQuery (dest=DestRemote) at dest.c:251
251 {
(gdb) bt
#0  ReadyForQuery (dest=DestRemote) at dest.c:251
#1  0x0000564975eb6eee in PostgresMain (argc=1, argv=0x564977465a08,
    dbname=0x5649774658d0 "carytest", username=0x5649774658b8 "cary") at postgres.c:4176
#2  0x0000564975e13a97 in BackendRun (port=0x56497745dfa0) at postmaster.c:4431
#3  0x0000564975e131ba in BackendStartup (port=0x56497745dfa0) at postmaster.c:4122
#4  0x0000564975e0f53e in ServerLoop () at postmaster.c:1704
#5  0x0000564975e0ecd4 in PostmasterMain (argc=3, argv=0x5649774344c0) at postmaster.c:1377
#6  0x0000564975d3210f in main (argc=3, argv=0x5649774344c0) at main.c:228

(gdb) n
252   switch (dest)
(gdb)
257       if (PG_PROTOCOL_MAJOR(FrontendProtocol) >= 3)
(gdb)
261         pq_beginmessage(&buf, 'Z');
(gdb)
262         pq_sendbyte(&buf, TransactionBlockStatusCode());
(gdb)
263         pq_endmessage(&buf);
(gdb) p dest
$90 = DestRemote
(gdb)  n
268       pq_flush();
(gdb)
269       break;
(gdb)
282 }
(gdb)
as pq_flush() is called, the result of the query will be returned back to the client at remote destination.
10.1 Client Results
Client will now see the output below as a result of the query
carytest=> select serial_number, count(serial_number) from devicedata GROUP BY serial_number ORDER BY count DESC LIMIT 2;
 serial_number | count
---------------+-------
 X00002        |     8
 X00003        |     6
(2 rows)
11 Summary
So far, we have traced through severl stags of query processing. Namely
Parser
Analyzer
Rewritter
Planner
Executor
To summarize all the above, I have created a simple call hierarchy ( or a list of breakpoints) below that outlines the important core functions that will be called while stepping through the above stages. The ‘b’ in front of each function name corresponds to the break point command of gdb.
## Main Entry ##
b exec_simple_query

  ## Parser ##
  b pg_parse_query            -> returns (List* of Query)
    b raw_parser              -> returns (List* of Query)
      b base_yyparse          -> returns (List* of Query)

  ## Analzyer and Rewritter ##
  b pg_analyze_and_rewrite    -> returns (List*)
    b parse_analyze           -> returns (Query*)
    b pg_rewrite_query        -> returns (List* of Query)
      b QueryRewrite          -> returns (List* of Query)

  ## Planner ##
  b pg_plan_queries           -> returns (List* of plannedStmt)
    b pg_plan_query           -> returns (PlannedStmt*)
      b planner               -> returns (PlannedStmt*)

  ## Executor ##
  b PortalStart               -> returns void
    b ExecutorStart           -> returns void

  b PortalRun                 -> returns bool
    b PortalRunSelect         -> returns uint64
      b ExecutorRun           -> returns void

  b PortalDrop                -> returns void
    b PortalCleanup           -> returns void
      b ExecutorFinish        -> returns void
      b ExecutorEnd           -> returns void

  ## Present Result ##
b ReadyForQuery               -> returns void
  b pq_flush                  -> returns void