


1. Introduction
Few weeks ago, I was tasked to have a detailed look inside PostgreSQL’s extended query protocol and study its internal mechanisms for a project that depends on this particular feature. In this blog, I will explain how extended protocol works in my own words and how it differs from simple query.
2. Simple Query
A client is able to initiate 2 type of queries against a PostgreSQL server, simple query or extended query. Simple query, as the name suggests, is very simple and straightforward to understand. When we launch the psql client tool to connect to a PostgreSQLs server, almost all of the SQL commands sent are considered as simple queries. This includes the use of begin and commit to enclose a transaction, having multiple SQL queries included in one big query separated by a semicolon, executing or defining a function and much more.
Simple query automatically follows the standard query processing routines, which consist of these stages:
- Parser
- Analyzer
- Rewriter
- Planner
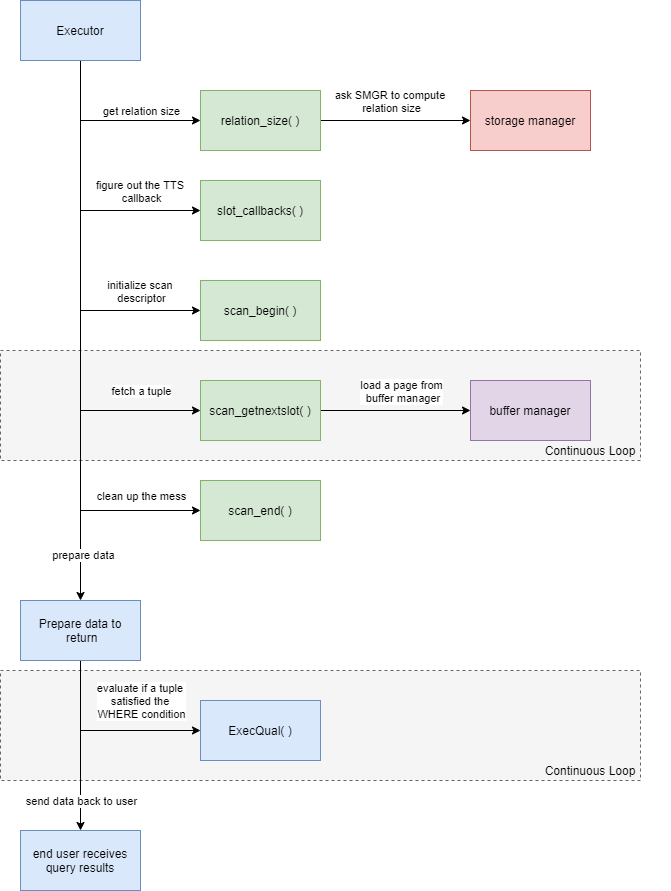
- Executor
Refer to this blog here for detailed information about query processing.
The communication between the client and the server is also very straightforward. In case of DML operations such as INSERT, the client sends the query to the server for processing and the server responds a CommandComplete message such as INSERT 0 1 followed by a ReadyForQuery(IDLE) message to indicate that the server has finished the query and is now idle. The client can send another query and it follows the same patter.
In case of a SELECT query, the server will send the row description followed by the actual row data satisfying the query until there is no more rows to return. In the end, the server sends a ReadyForQuery(IDLE) message to indicate that the server has finished the query and is now idle.
3. Extended Query
Extended query is the other way for the client to complete a query excepts that it breaks down the standard query processing into different steps and the client is responsible to ensure these steps are followed and executed correctly. The client is able to control thses steps by sending the following wire protocol message types:
‘P’ message (Parse)
Pmessage takes a generalize query string with data values repalced with placeholders like$1,$2, which can be later substitued with real values in the Bind step.- This generalized query string will be parsed via these query processing routines:
Parser->Analyzer->Rewriter - At the end of a successful Parse, a
prepared statementis produced, similar to SQL’sPREPAREclause - This
prepared statementcan benamedorunnammed(more on this next). - This
prepared statementis just a representation of the input query and it cannot be executed yet.
‘B’ message (Bind)
Btakes thenamedorunnammedprepared statementproduced from thePmessage and replaces the placeholders ($1, $2) with the user-supplied values.- After the values are bound to the
prepared statement, we basically have a completed query and it will then be fed into theplannerstage to produce the most optimized query plan for the query. - At the end of a successful planning, a
portalis produced. - This
portalcan also benamedorunnammed(more on this next) - A portal is basically an object that represents how to execute a particular query
‘E’ message (Execute)
Etakes thenamedorunnamedportalproduced from theBmessage and actuallly launch theexecutorto execute the query (or portal).- resultant rows are produced (if any) and returns to the client
‘S’ message (Sync)
- The client has to send a
Smessage to the server to indicate the end of the extended query. - This message causes the server to end the current transaction and sends
ReadyForQuery(IDLE)message back to client.
- The client has to send a
What is the purpose of separating a simple query into multiple steps? One major benefit of using the extended query is that it can save a lot of unnecessary parsing of the same query structure. Instead, we can have the common strucuture parsed only once and then bind and execute with different values multiple times.
4. Named and Unnamed Prepared Statement and Portal
In previous section we mentioned that a prepared statement and protal can be either named or unnamed during the extended query protocol. What does it mean and what is the significance?
The general rule is that PostgreSQL server can only keep one unnamed prepared statement or portal. Requests containing unnamed prepared statemnt or portal will replace the existing ones.
With named prepared statement or portal, the server will respectively remember them based on the names given and client is able to invoke them any time or specifically destroyed by sending a Close message.
So, it is possible for a client to create multiple prepared statements within a transaction, each having different prepared statement names, and then bind values for them all at the same time by giving them different portal names. Eventually, the client chooses which portal to be executed.
More importantly, named prepared statement’s life time lasts for the entire TCP session unless explicitly destroyed; named portal lasts only until the end of transaction or when it is executed or explicitly destroyed.
But, does it make client implementation more complicated if extended query is used?
Yes, but client has a choice to complicate things or not
Taking libpq for example, when extended query is used, it requires the client application to provide a prepared statement name to construct the P (Parse) message, but does not require the client application to provide portal name to construct the B (Bind) message. This means that with libpq, we can send P message multiple times with different prepared statement names, but with B message, it forces to use unnamed portal name, so we always have one portal to execute. This avoids the case with multiple portal names in the client side to manage.