How PostgreSQL Handles Sub Transaction Visibility In Streaming Replication Setup?

1. Introduction

As an experienced PostgreSQL user, you may have a lot of experience in setting up streaming replication in your database clusters to make multiple backups of your data. But have you wondered how the standby is able to correctly determine if a tuple sent from the primary should be visible to the user or not. In the case where a transaction contains multiple subtransactions, how does the standby determine the visibility in this case? You might say… well it is PostgreSQL so it will just work… This is true. If you are someone who is curious and interested in knowing how PostgreSQL does certain things internally, then this blog may be interesting for you as we will talk about normally transaction and subtransactions and how both affect the standby’s ability to determine tuple visibility.

2. How is Tuple Visibility Determined?

PostgreSQL determines a tuple’s visibility based on the concept of transaction ID (a.k.a txid) and it is normally stored in a tuple’s header as either xmin or xmax where xmin holds the txid of the transaction that inserted this tuple and t_xmax holds the txid of the transaction that deleted or updated this tuple. If a tuple has not been deleted, its t_xmax is 0. There is also another mechanism called commit log (a.k.a clog) where it has information of currently active transaction IDs. When an inserted tuple has a valid t_xmin and invalid t_xmax, PostgreSQL will have to consult the clog first to determine if the txid stored in t_xmin is visible or not, then the result will be stored in the tuple’s hint_bit field about the visibility information such that it does not always have to consult the clog which could be resource intensive. If a tuple has a valid t_xmax, then there is no need to consult the clog as the tuple must be invisible.

This is just the basic ideas of how visibility is determined but it is enough for me to continue with this blog. For more information about visibility, you could refer to this resource

3. What is a Subtransaction?

As the name suggests, it is a smaller transaction that exists within a regular transaction and it can be created using the SAVEPOINT keyword after your BEGIN statement. Normally, when you have issued a BEGIN statement, all the tuples created from the subsequent DML statements such as INSERT or UPDATE will have a txid associated with these tuples and they will all be the same.

When you issue a SAVEPOINT statement within this transaction, all the tuples created from the subsequent DML statements will have a different txid that is normally larger than the main transaction’s txid. When you issue the SAVEPOINT statement again, the txid changes again.

The advantage of Subtransaction is that in a very large transaction, the entire transaction will not be aborted due to an error. It allows you to rollback to the previously created SAVEPOINT and continue to execute the main transaction.

The biggest difference between a subtransaction and a regular transaction is that there is not a concept of commit associated with subtransactions and it will not be recorded in the WAL file. However, if subtransaction is aborted, it will be recorded in the WAL file and subsequently be sent to the standby.

4. How Does a Standby Determines Visibility Information In a Regular Transaction?

Here’s an example of a regular transaction without any subtransactions:

BEGIN;
INSERT INTO test VALUES(111,111111); => a heap_redo WAL record having t_xmin = 500 is sent to standby
INSERT INTO test VALUES(111,222222); => a heap_redo WAL record having t_xmin = 500 is sent to standby
INSERT INTO test VALUES(111,333333); => a heap_redo WAL record having t_xmin = 500 is sent to standby
COMMIT; => a XLOG_XACT_COMMIT WAL record having t_xmin = 500 is sent to standby

In a general case, the above queries will send at least 4 WAL records to the standby during streaming replication. First 3 contain the actual tuple information with t_xmin set to the current transaction ID which is 500 in the example. In other words, before the COMMIT is issued, the standby should have already received 3 WAL records from primary and completed the redo, meaning that the 3 tuples already exist in standby’s memory buffer. However, they are not visible yet because transaction ID 500 does not exist in the standby. It is until the COMMIT is issued in the primary that will subsequently generate a XLOG_XACT_COMMIT WAL record to be sent to standby to notify that transaction ID 500 is now committed and valid. When standby receives the XLOG_XACT_COMMIT WAL record, it will eventually update to its clog so the subsequent SELECT queries can do visibility check against.

5. How Does a Standby Process Visibility Information In a Regular Transaction Containing Subtransactions?

Now, let’s use the same example but add some SAVEPOINT to create subtransactions

BEGIN;
INSERT INTO test VALUES(111,111111); => a heap_redo WAL record having t_xmin = 500 is sent to standby
INSERT INTO test VALUES(111,222222); => a heap_redo WAL record having t_xmin = 500 is sent to standby
INSERT INTO test VALUES(111,333333); => a heap_redo WAL record having t_xmin = 500 is sent to standby
SAVEPOINT A;
INSERT INTO test VALUES(111,444444); => a heap_redo WAL record having t_xmin = 501 is sent to standby
INSERT INTO test VALUES(111,555555); => a heap_redo WAL record having t_xmin = 501 is sent to standby
INSERT INTO test VALUES(111,666666); => a heap_redo WAL record having t_xmin = 501 is sent to standby
SAVEPOINT B;
INSERT INTO test VALUES(111,777777); => a heap_redo WAL record having t_xmin = 502 is sent to standby
INSERT INTO test VALUES(111,888888); => a heap_redo WAL record having t_xmin = 502 is sent to standby
INSERT INTO test VALUES(111,999999); => a heap_redo WAL record having t_xmin = 502 is sent to standby
COMMIT; => a XLOG_XACT_COMMIT WAL record having t_xmin = 500 is sent to standby

As you can see, after the creation of SAVEPOINT, the tuple’s t_xmin value will be changed and is no longer equal to the current transaction ID, which is 500 in the example. Before the COMMIT is issued, the standby should have received 9 WAL records, 3 having t_xmin = 500, 3 having t_xmin = 501 and 3 having t_xmin = 502. None of them is visible yet in the standby because these transaction IDs do not exist yet. When the primary issues the COMMIT statement, it will generate a XLOG_XACT_COMMIT WAL record and send to standby containing only the current transaction ID 500 without the 501 and 502.

After the commit, the standby is able to see all 9 tuples that are replicated from the primary. Now, you may be asking…. why? How come the standby knows that txid = 501 and 502 are also visible even though the primary never send a XLOG_XACT_COMMIT WAL record to tell the standby that 501 and 502 are also committed. Keep reading to find out.

Using the similar example, if we rollback to one of the SAVEPOINTs, the primary will send a XLOG_XACT_ABORT WAL record to notify the standby a transaction ID has become invalid.

BEGIN;
INSERT INTO test VALUES(111,111111); => a heap_redo WAL record having t_xmin = 500 is sent to standby
INSERT INTO test VALUES(111,222222); => a heap_redo WAL record having t_xmin = 500 is sent to standby
INSERT INTO test VALUES(111,333333); => a heap_redo WAL record having t_xmin = 500 is sent to standby
SAVEPOINT A;
INSERT INTO test VALUES(111,444444); => a heap_redo WAL record having t_xmin = 501 is sent to standby
INSERT INTO test VALUES(111,555555); => a heap_redo WAL record having t_xmin = 501 is sent to standby
INSERT INTO test VALUES(111,666666); => a heap_redo WAL record having t_xmin = 501 is sent to standby
SAVEPOINT B;
INSERT INTO test VALUES(111,777777); => a heap_redo WAL record having t_xmin = 502 is sent to standby
INSERT INTO test VALUES(111,888888); => a heap_redo WAL record having t_xmin = 502 is sent to standby
INSERT INTO test VALUES(111,999999); => a heap_redo WAL record having t_xmin = 502 is sent to standby
ROLLBACK TO SAVEPOINT B; => a XLOG_XACT_ABORT WAL record having t_xmin = 502 is sent to standby
COMMIT; => a XLOG_XACT_COMMIT WAL record having t_xmin = 500 is sent to standby

In this example, when doing a ROLLBACK to SAVEPOINT B, a XLOG_XACT_ABORT WAL record will be sent to the standby to invalidate that the transaction ID 502 is invalid. So when primary commits, records having txid=502 will not be visible as primary has notified.

6. The Secret of Standby’s KnownAssignedTransactionIds

In addition to handling the XLOG_XACT_COMMIT and XLOG_XACT_ABORT WAL records to determine if a txid is valid or not, it actually manages a global txid list called KnownAssignedTransactionIds. Whenever a standby receives a heap_redo WAL record, it will save its xmin to KnownAssignedTransactionIds. Using the same example as above again here:

BEGIN;
INSERT INTO test VALUES(111,111111); => a heap_redo WAL record having t_xmin = 500 is sent to standby, and standby puts 500 in KnownAssignedTransactionIds
INSERT INTO test VALUES(111,222222); => a heap_redo WAL record having t_xmin = 500 is sent to standby, and standby puts 500 in KnownAssignedTransactionIds
INSERT INTO test VALUES(111,333333); => a heap_redo WAL record having t_xmin = 500 is sent to standby, and standby puts 500 in KnownAssignedTransactionIds
SAVEPOINT A;
INSERT INTO test VALUES(111,444444); => a heap_redo WAL record having t_xmin = 501 is sent to standby, and standby puts 501 in KnownAssignedTransactionIds
INSERT INTO test VALUES(111,555555); => a heap_redo WAL record having t_xmin = 501 is sent to standby, and standby puts 501 in KnownAssignedTransactionIds
INSERT INTO test VALUES(111,666666); => a heap_redo WAL record having t_xmin = 501 is sent to standby, and standby puts 501 in KnownAssignedTransactionIds
SAVEPOINT B;
INSERT INTO test VALUES(111,777777); => a heap_redo WAL record having t_xmin = 502 is sent to standby, and standby puts 502 in KnownAssignedTransactionIds
INSERT INTO test VALUES(111,888888); => a heap_redo WAL record having t_xmin = 502 is sent to standby, and standby puts 502 in KnownAssignedTransactionIds
INSERT INTO test VALUES(111,999999); => a heap_redo WAL record having t_xmin = 502 is sent to standby, and standby puts 502 in KnownAssignedTransactionIds
COMMIT; => a XLOG_XACT_COMMIT WAL record having t_xmin = 500 is sent to standby and standby submits 500, 501 and 502 to clog as valid.

Before the COMMIT is issued on the primary, the standby already has txid 500, 501, and 502 present in the KnownAssignedTransactionIds. When the standby receives XLOG_XACT_COMMIT WAL, it will actually submit txid 500 from the WAL plus the 501 and 502 from KnownAssignedTransactionIds to the clog. So that the subsequent SELECT query consult the clog it will say txid 500, 501, and 502 are visible. If the primary sends XLOG_XACT_ABORT as a result of rolling back to a previous SAVEPOINT, that invalid txid will be removed from the KnownAssignedTransactionIds, so when the transaction commits, the invalid txid will not be submit to clog.

7. Summary

So this is how PostgreSQL determines a tuple’s visibility within subtransactions in a streaming replication setup. Of course, there is more details to what is discussed here in this blog, but I hope today’s discussion can help you get a general understanding of how PostgreSQL determines the visibility and maybe it will help you in your current work on PostgreSQL.
How PostgreSQL Inserts A New Record With The help of Table Access Method API and Buffer Manager

1. Introduction

This blog talks about a high level description of the mechanism behind PostgreSQL to execute an INSERT query. This process involves many steps of processing before the data is put in the right place. These process normally involves several catalog cache lookup to determine if the destination table exists or several checking on the constraint violations..etc. This blog will mainly focus on the part where the processing handle is passed to the PostgreSQL’s table access method API and its interaction with buffer manager and WAL routines. This is also the core area where an INSERT query is actually executed. If you are a developer looking to understand how PostgreSQL works internally, this blog may be helpful to you…

2. Table Access Method APIs in PostgreSQL

Pluggable table access method API has been made available since PostgreSQL 12, which allows a developer to redefine how PostgreSQL stores / retrieves table data. This API contains a total of 42 routines that need to be implemented in order to complete the implementation and honestly it is no easy task to understand all of them and to implement them. This API structure is defined in tableam.h under the name typedef struct TableAmRoutine

Today I will describe the routines related to INSERT.

3. INSERT Query Overall Call Flow

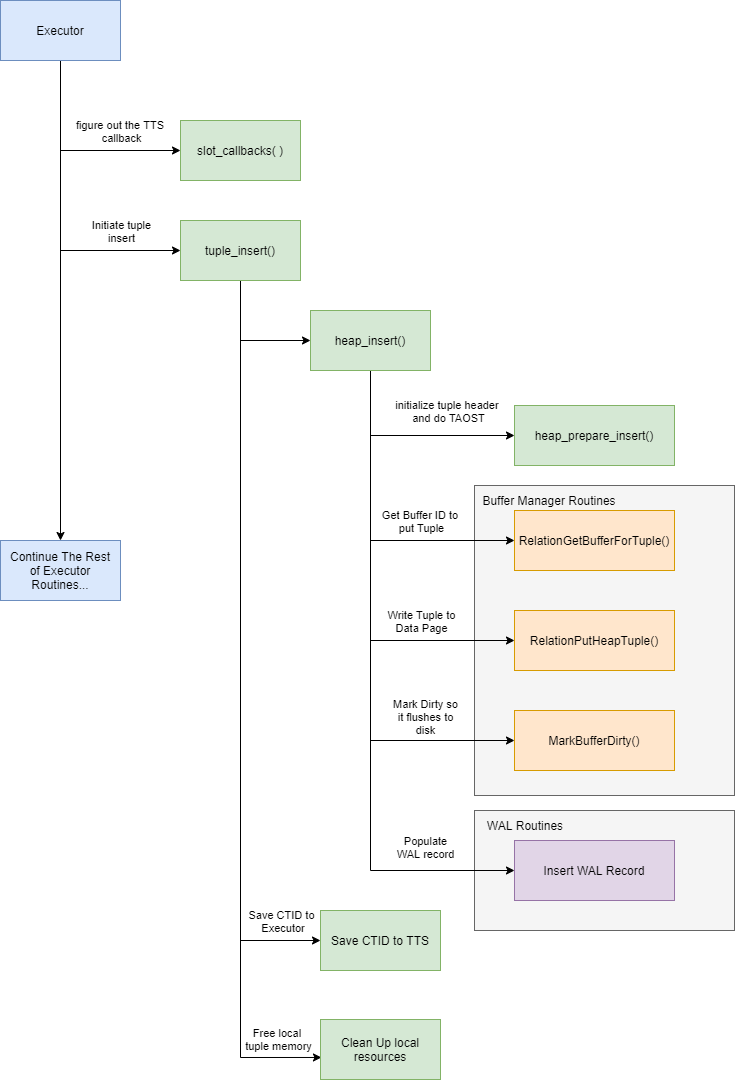
A few of the 42 routines will be called by executor just to complete an INSERT query. This section will describe these routines in the order they are called.

3.1 slot_callbacks

const TupleTableSlotOps *(*slot_callbacks) (Relation rel);

The executor needs to find out which set of tuple table slot (TTS) callback operation this table access method is compatible with. TTS is a set of routines that ensures the tuple storage is compatible between the executor and your access method. The executor will execute the TTS callback to translate your tuple strucuture to TupleTableSlot format in which the executor will understand. The default heap access method uses TTSOpsBufferHeapTuple defined in execTuples.c to handle this operation

3.2 heap_insert

void
heap_insert(Relation relation, HeapTuple tup, CommandId cid,
int options, BulkInsertState bistate)

heap_insert is the entry point to perform the actual data insertion and it will undergo several other routines provided by buffer manager and WAL module in order to complete the insertion.

heap_prepare_insert
static HeapTuple heap_prepare_insert(Relation relation, HeapTuple tup,
TransactionId xid, CommandId cid, int options);

This is a subroutine for heap_insert where it will initialize the tuple header contents such as relation OID, infomasks, xmin, xmax values. It will also determine if the tuple is too big that TOAST is required to complete the insertion. These terms and parameters are very technical in PostgreSQL. If you are not sure what exactly they are, you could refer to resources here and here.

RelationGetBufferForTuple
extern Buffer RelationGetBufferForTuple(Relation relation, Size len,
Buffer otherBuffer, int options,
BulkInsertStateData *bistate,
Buffer *vmbuffer, Buffer *vmbuffer_other);

This is an entry function to access buffer manager resources and all it is doing is ask the buffer manager to return a buffer ID that can be used to store the target tuple. This may sound very straightforward, but there is quite a lot of processing on the buffer manager side to properly determine a desired buffer location.

First, it will do a quick size check. If the input tuple is larger than the size of each buffer block, it will return immediately with error as TOAST has to be used in this case. Then it will try to put the tuple on the same page the system last inserted the tuple on to see if it will fit there. If not, it will utilize the free space map to find another page that could fit tuple. If that does not work out, then buffer manage will allocate a new data page (also referred to as extend) to be used to hold this new tuple. As soon as we have a desired buffer page determined, buffer manager will cache this page in the relation structure such that next time the same relation visits the buffer manager, it knows immediately about the reference to the last inserted block.

RelationPutHeapTuple
extern void RelationPutHeapTuple(Relation relation, Buffer buffer,
HeapTuple tuple, bool token);

Once we have identified the location of the buffer to store the tuple, the insert routine will then call RelationPutHeapTuple to actually put the tuple in the specified buffer location. This routine will again ask the buffer manager to get a pointer reference to the data page using the buffer ID we obtained from RelationGetBufferForTuple, then add the tuple data using PageAddItem() routine. Internally in buffer manager, it manages the relationship between buffer ID, buffer descriptor and the actual pointer to the data page to help us correctly identify and write to a data page. After a successful write, the routine will save a CTID of the inserted tuple. This ID is the location of this tuple and it consists of the data page number and the offset. For more information about how buffer manager works, you can refer to the resource here

Mark buffer dirty
extern void MarkBufferDirty(Buffer buffer);

At this point, the tuple data is already stored in the buffer manager referenced by a particular data page plus an offset, but it is not yet flushed to disk yet. In this case, we almost always will have to call MarkBufferDirty function to signal buffer manager that there are some tuples on the page that have not been flushed to disk and therefore in the next checkpoint, it will ensure the new tuples are flushed to disk.

[Insert WAL Record]

Last but not least, after doing all the hassle of finding a buffer location to put our tuple in and mark it as dirty, it is time for the heap_insert routine to populate a WAL record. This part is not the focus of this blog so I will skip the high level details of WAL writing.

3.3 End of the insertion

At this point the insertion of a new tuple data has finished and proper WAL record has been written. The routine will once again save the CTID value that we derived during the data insertion and save this value to the TTS structure so the executor also gets a copy of the location of the tuple. Then it will clean up the local resources before returning.

4. Summary

What we have discussed here is the basic call flow of a simple sequential scan. If we were to visualize the process, it should look something like this:
tuple insert

How PostgreSQL Executes Sequential Scans with the Help of Table Access Methods APIs

1. Introduction

There are many approaches for PostgreSQL to retrieve the data back to the user. Depending on the user’s input query, the planner module is responsible for selecting the most optimum approach to retrieve the requested data. Sequential scan is one of these approaches that is mostly selected when the user requests a large volume of data (for example, “SELECT * from tablename;”) or when a table has no index declared. Sequential scan is mostly handled by the table access method API within PostgreSQL and heap access method is the default one PostgreSQL uses today. In this short post, I will show you how sequential scan is done in the table access method API.

2. Table Access Method APIs in PostgreSQL

Pluggable table access method API has been made available since PostgreSQL 12, which allows a developer to redefine how PostgreSQL stores / retrieves table data. This API contains a total of 42 routines that need to be implemented in order to complete the implementation and honestly it is no easy task to understand all of them and to implement them. This API structure is defined in tableam.h under the name typedef struct TableAmRoutine

Today I will describe the routines related to sequential scan and I hope it could help you if you are someone looking to create your own table access method.

3. Sequential Scan Overall Call Flow

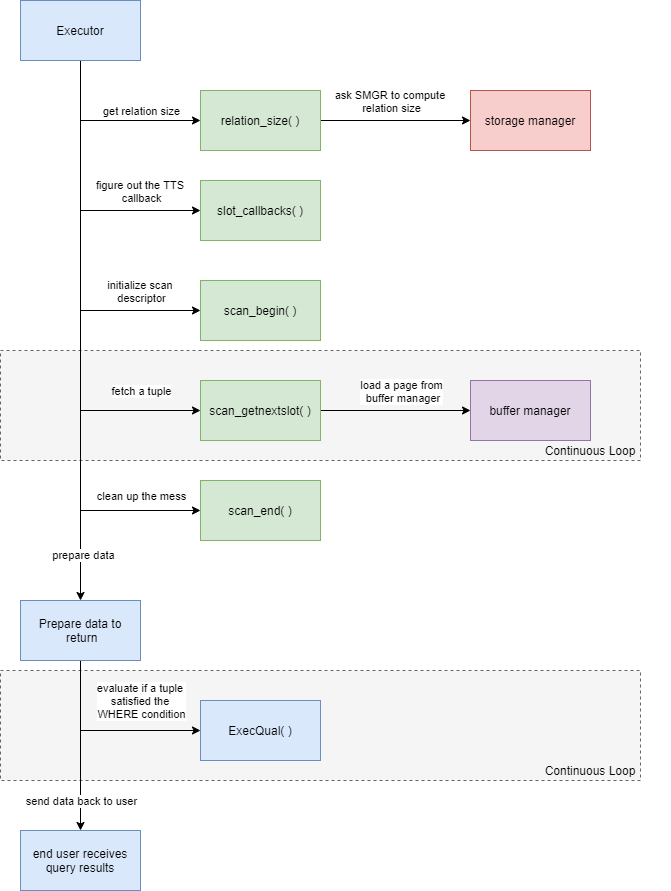
Few of the 42 routines will be called by executor just to complete a sequential scan request. This section will describe these routines in the order they are called.

3.1 relation_size

uint64		(*relation_size) (Relation rel, ForkNumber forkNumber);

relation_size is the first routine to be called and it is relatively simple. The caller will expect the routine to return the total size of the relation described by rel and forkNumber. The default heap access method will simply invoke the storage manager smgr to find the number of data blocks this particular relation physically occupies on disk and multiplies that number with the size of each block BLCKSZ (default is 8k). If you are not sure about the relationship between relation and its fork number, you could refer to this blog to get more information.

The size returned by this routine basically sets the boundary of our sequential scan.

3.2 slot_callbacks

const TupleTableSlotOps *(*slot_callbacks) (Relation rel);

Next, the executor needs to find out which set of tuple table slot (TTS) callback operation this table access method is compatible with. TTS is a set of routines that ensures the tuple storage is compatible between the executor and your access method. The executor will execute the TTS callback to translate your tuple strucuture to TupleTableSlot format in which the executor will understand. The default heap access method uses TTSOpsBufferHeapTuple defined in execTuples.c to handle this operation

3.3 scan_begin

TableScanDesc (*scan_begin) (Relation rel,
Snapshot snapshot,
int nkeys, struct ScanKeyData *key,
ParallelTableScanDesc pscan,
uint32 flags);

Now the scan can officially begin. This is sequential scan’s initialization routine in which it will allocate a new scan descriptor using the parameters passed in by the executor. The purpose of scan descriptor structure is to keep track of the sequential scan while it is being executed. For example, to track where the scan should begin,; when was the block number of the last scan; which block should we resume scanning and how many blocks have been scanned…etc. scan descriptor will be destroyed once the sequential scan has completed.

The executor expects the routine to return a fully allocated and initialize pointer to TableScanDesc struct

3.4 scan_getnextslot

bool		(*scan_getnextslot) (TableScanDesc scan,
ScanDirection direction,
TupleTableSlot *slot);

This is the main routine for sequential scan where the caller expects the routine to fetch one tuple from the buffer manager, converts it to the TTS format in which executor understands and save it in the input pointer called slot. Each call to this routine will results in one tuple to be returned. If a table contains 1000 tuples, this function will be called 1000 times. The boolean return code is the indication to the caller if the routine has more tuples to return, as soon as false is returned, it signals the executor that we have exhausted all the tuples and it should stop calling this function.

In normal sequential scan case, this routine works in per-page mode. This means it will read one full block from buffer manager and scan it to get all the tuple addresses and their offsets in the scan descriptor, so in the subsequent calls to the same function, it will not load the full page again from buffer manage all the time; it will only start to load the next block when all the tuples on the current block have been scanned and returned.

As you can see, the scan descriptor plays an important role here as most of the control information is saved there and is regularly updated whenever a call the scan_getnextslot is made.

3.5 scan_end

void		(*scan_end) (TableScanDesc scan);

This is the last routine to be called to basically clean up the table scan descriptor, which was used heavily during the sequential scan. At this point, the executor should already have all the tuple information from the sequential scan methods.

4. Prepare the Data to Return

Now, the executor is finished with the table access method and has already had access to all the tuples for a particular relation. It then needs to go through another round of filtering to determine which of these tuples satisfy the condition set by the user, (for example, when user gives the WHERE clause to limit the scan results). This is done in another infinite for loop in execScan.c to perform ExecQual on each TTS. Finally, the end results will be sent to the end user.

5. Summary

What we have discussed here is the basic call flow of a simple sequential scan. If we were to visualize the process, it should look something like this:
Sequential Scan

How to Analyze a PostgreSQL Crash Dump File

1. Introduction

In this blog post, I will talk about how to enable the generation of crash dump file (also known as core dump) and some common GDB commands to help a developer troubleshoot a crash-related issues within PostgreSQL and also other applications. Proper analysis of the issue normally will take time and certain degree of knowledge about the application source code. From experience, sometimes it may be better to look at the bigger environment instead of looking at the point of crash.

2. What is a Crash Dump File?

A crash dump file is a file that consists of the recorded state of the working memory of an application when it crashes. This state is represented by stacks of memory addresses and CPU registers and normally it is extremely difficult to debug with only memory addresses and CPU registers because they tell you no information about the application logic. Considering the core dump contents below, which shows the back trace of memory addresses to the point of crash.

#1  0x00687a3d in ?? ()
#2 0x00d37f06 in ?? ()
#3 0x00bf0ba4 in ?? ()
#4 0x00d3333b in ?? ()
#5 0x00d3f682 in ?? ()
#6 0x00d3407b in ?? ()
#7 0x00d3f2f7 in ?? ()

Not very useful is it? So, when we see a crash dump file that looks like this, it means the application is not built with debugging symbols, making this crash dump file useless. If this is the case, you will need to install the debug version of the application or re-build the application with debugging enabled.

3. How to Generate a Useful Crash Dump File

Before the generation of crash dump file, we need to ensure the application is built with debugging symbols. This can be done by executing the ./configure script like this:

./configure enable-debug

This adds the -g argument to CFLAGS in src/Makefile.global with optimization level set to 2 (-O2). My preference is to also change the optimization to 0 (-O0) so when we are navigating the stack using GDB, the navigation will make much more sense rather than jumping around and we will be able to print out most variables values in memory instead of getting optimized out error in GDB.

CFLAGS = -Wall -Wmissing-prototypes -Wpointer-arith -Wdeclaration-after-statement -Werror=vla -Wendif-labels -Wmissing-format-attribute -Wimplicit-fallthrough=3 -Wformat-security -fno-strict-aliasing -fwrapv -fexcess-precision=standard -Wno-format-truncation -g -O0

Now, we can enable the crash dump generation. This can be done by the user limit command.

ulimit -c unlimited

to disable:

ulimit -c 0

Make sure there is enough disk space because crash dump file is normally very large as it records all the memory execution states from start to crash, and make sure the ulimit is set up in the shell before starting PostgreSQL. When PostgreSQL crashes, a core dump file named core will be generated in $PGDATA

4. Analyzing the Dump File using GDB

GDB (GNU Debugger) is a portable debugger that runs on many Unix-like systems and can work with many programming languages and is my favorite tool to analyze a crash dump file. To demonstrate this, I will intentionally add a line in PostgreSQL source code that will result in segmentation fault crash type when a CREATE TABLE command is run.

Assuming the PostgreSQL has already crashed and generated a core dump file core in this location ~/highgo/git/postgres/postgresdb/core. I would first use the file utility to understand more about the core file. Information such as the kernel info, and the program that generated it.

caryh@HGPC01:~$ file /home/caryh/highgo/git/postgres/postgresdb/core
postgresdb/core: ELF 64-bit LSB core file x86-64, version 1 (SYSV), SVR4-style, from 'postgres: cary cary [local] CREATE TABLE', real uid: 1000, effective uid: 1000, real gid: 1000, effective gid: 1000, execfn: '/home/caryh/highgo/git/postgres/highgo/bin/postgres', platform: 'x86_64'
caryh@HGPC01:~$

The file utility tells me that the core file is generated by this application /home/caryh/highgo/git/postgres/highgo/bin/postgres, so I would execute gdb like this:

gdb /home/caryh/highgo/git/postgres/highgo/bin/postgres -c  /home/caryh/highgo/git/postgres/postgresdb/core

GNU gdb (Ubuntu 8.1-0ubuntu3) 8.1.0.20180409-git
Copyright (C) 2018 Free Software Foundation, Inc.
License GPLv3+: GNU GPL version 3 or later <http://gnu.org/licenses/gpl.html>
This is free software: you are free to change and redistribute it.
There is NO WARRANTY, to the extent permitted by law. Type "show copying"
and "show warranty" for details.
This GDB was configured as "x86_64-linux-gnu".
Type "show configuration" for configuration details.
For bug reporting instructions, please see:
<http://www.gnu.org/software/gdb/bugs/>.
Find the GDB manual and other documentation resources online at:
<http://www.gnu.org/software/gdb/documentation/>.
For help, type "help".
Type "apropos word" to search for commands related to "word"...
Reading symbols from /home/caryh/highgo/git/postgres/highgo/bin/postgres...done.
[New LWP 27417]
[Thread debugging using libthread_db enabled]
Using host libthread_db library "/lib/x86_64-linux-gnu/libthread_db.so.1".
Core was generated by `postgres: cary cary [local] CREATE TABLE '.
Program terminated with signal SIGSEGV, Segmentation fault.
#0 heap_insert (relation=relation@entry=0x7f872f532228, tup=tup@entry=0x55ba8290f778, cid=0, options=options@entry=0,
bistate=bistate@entry=0x0) at heapam.c:1840
1840 ereport(LOG,(errmsg("heap tuple len = %d", heaptup->t_len)));
(gdb)

Immediately after running gdb on the core file, it shows the location of the crash at heapam.c:1840 and that is exactly the line I have intentionally added to cause a crash.

5. Useful GDB Commands

With gdb, it is very easy to identify the location of a crash, because it tells you immediately after running gdb on the core file. Unfortunately, 95% of the time, the location of the crash is not the real cause of the problem. This is why I mentioned earlier that sometimes it may be better to look at the bigger environment instead of looking at the point of crash. The crash is likely caused by a mistake in the application logic some where else in the application before it hits the point of crash. Even if you fix the crash, the mistake in application logic still exists and most likely, the application will crash somewhere else later or yield unsatisfactory results. Therefore, it is worth awhile to understand some of the powerful GDB commands that could help us understand the call stacks better to identify the real root cause.

5.1 The bt (Back Trace) command

The bt command shows a series of call stacks since the beginning of the application all the way to the point of crash. With full debugging enabled, you will be able to see the function arguments and values being passed in to each function calls as well as the source file and line numbers where they were called. This allows developer to travel backwards to check for any potential application logic mistake in the earlier processing.


(gdb) bt
#0 heap_insert (relation=relation@entry=0x7f872f532228, tup=tup@entry=0x55ba8290f778, cid=0, options=options@entry=0,
bistate=bistate@entry=0x0) at heapam.c:1840
#1 0x000055ba81ccde3e in simple_heap_insert (relation=relation@entry=0x7f872f532228, tup=tup@entry=0x55ba8290f778)
at heapam.c:2356
#2 0x000055ba81d7826d in CatalogTupleInsert (heapRel=0x7f872f532228, tup=0x55ba8290f778) at indexing.c:228
#3 0x000055ba81d946ea in TypeCreate (newTypeOid=newTypeOid@entry=0, typeName=typeName@entry=0x7ffcf56ef820 "test",
typeNamespace=typeNamespace@entry=2200, relationOid=relationOid@entry=16392, relationKind=relationKind@entry=114 'r',
ownerId=ownerId@entry=16385, internalSize=-1, typeType=99 'c', typeCategory=67 'C', typePreferred=false,
typDelim=44 ',', inputProcedure=2290, outputProcedure=2291, receiveProcedure=2402, sendProcedure=2403,
typmodinProcedure=0, typmodoutProcedure=0, analyzeProcedure=0, elementType=0, isImplicitArray=false, arrayType=16393,
baseType=0, defaultTypeValue=0x0, defaultTypeBin=0x0, passedByValue=false, alignment=100 'd', storage=120 'x',
typeMod=-1, typNDims=0, typeNotNull=false, typeCollation=0) at pg_type.c:484
#4 0x000055ba81d710bc in AddNewRelationType (new_array_type=16393, new_row_type=<optimized out>, ownerid=<optimized out>,
new_rel_kind=<optimized out>, new_rel_oid=<optimized out>, typeNamespace=2200, typeName=0x7ffcf56ef820 "test")
at heap.c:1033
#5 heap_create_with_catalog (relname=relname@entry=0x7ffcf56ef820 "test", relnamespace=relnamespace@entry=2200,
reltablespace=reltablespace@entry=0, relid=16392, relid@entry=0, reltypeid=reltypeid@entry=0,
reloftypeid=reloftypeid@entry=0, ownerid=16385, accessmtd=2, tupdesc=0x55ba8287c620, cooked_constraints=0x0,
relkind=114 'r', relpersistence=112 'p', shared_relation=false, mapped_relation=false, oncommit=ONCOMMIT_NOOP,
reloptions=0, use_user_acl=true, allow_system_table_mods=false, is_internal=false, relrewrite=0, typaddress=0x0)
at heap.c:1294
#6 0x000055ba81e3782a in DefineRelation (stmt=stmt@entry=0x55ba82876658, relkind=relkind@entry=114 'r', ownerId=16385,
ownerId@entry=0, typaddress=typaddress@entry=0x0,
queryString=queryString@entry=0x55ba82855648 "create table test (a int, b char(10)) using heap;") at tablecmds.c:885
#7 0x000055ba81fd5b2f in ProcessUtilitySlow (pstate=pstate@entry=0x55ba82876548, pstmt=pstmt@entry=0x55ba828565a0,
queryString=queryString@entry=0x55ba82855648 "create table test (a int, b char(10)) using heap;",
context=context@entry=PROCESS_UTILITY_TOPLEVEL, params=params@entry=0x0, queryEnv=queryEnv@entry=0x0, qc=0x7ffcf56efe50,
dest=0x55ba82856860) at utility.c:1161
#8 0x000055ba81fd4120 in standard_ProcessUtility (pstmt=0x55ba828565a0,
queryString=0x55ba82855648 "create table test (a int, b char(10)) using heap;", context=PROCESS_UTILITY_TOPLEVEL,
params=0x0, queryEnv=0x0, dest=0x55ba82856860, qc=0x7ffcf56efe50) at utility.c:1069
#9 0x000055ba81fd1962 in PortalRunUtility (portal=0x55ba828b7dd8, pstmt=0x55ba828565a0, isTopLevel=<optimized out>,
setHoldSnapshot=<optimized out>, dest=<optimized out>, qc=0x7ffcf56efe50) at pquery.c:1157
#10 0x000055ba81fd23e3 in PortalRunMulti (portal=portal@entry=0x55ba828b7dd8, isTopLevel=isTopLevel@entry=true,
setHoldSnapshot=setHoldSnapshot@entry=false, dest=dest@entry=0x55ba82856860, altdest=altdest@entry=0x55ba82856860,
qc=qc@entry=0x7ffcf56efe50) at pquery.c:1310
#11 0x000055ba81fd2f51 in PortalRun (portal=portal@entry=0x55ba828b7dd8, count=count@entry=9223372036854775807,
isTopLevel=isTopLevel@entry=true, run_once=run_once@entry=true, dest=dest@entry=0x55ba82856860,
altdest=altdest@entry=0x55ba82856860, qc=0x7ffcf56efe50) at pquery.c:779
#12 0x000055ba81fce967 in exec_simple_query (query_string=0x55ba82855648 "create table test (a int, b char(10)) using heap;")
at postgres.c:1239
#13 0x000055ba81fd0d7e in PostgresMain (argc=<optimized out>, argv=argv@entry=0x55ba8287fdb0, dbname=<optimized out>,
username=<optimized out>) at postgres.c:4315
#14 0x000055ba81f4f52a in BackendRun (port=0x55ba82877110, port=0x55ba82877110) at postmaster.c:4536
#15 BackendStartup (port=0x55ba82877110) at postmaster.c:4220
#16 ServerLoop () at postmaster.c:1739
#17 0x000055ba81f5063f in PostmasterMain (argc=3, argv=0x55ba8284fee0) at postmaster.c:1412
#18 0x000055ba81c91c04 in main (argc=3, argv=0x55ba8284fee0) at main.c:210
(gdb)

5.1 The f (Fly) command

The f command followed by a stack number allows gdb to jump to a particular call stack listed by the bt command and allows you to print other variable in that particular stack. For example:

(gdb) f 3
#3 0x000055ba81d946ea in TypeCreate (newTypeOid=newTypeOid@entry=0, typeName=typeName@entry=0x7ffcf56ef820 "test",
typeNamespace=typeNamespace@entry=2200, relationOid=relationOid@entry=16392, relationKind=relationKind@entry=114 'r',
ownerId=ownerId@entry=16385, internalSize=-1, typeType=99 'c', typeCategory=67 'C', typePreferred=false,
typDelim=44 ',', inputProcedure=2290, outputProcedure=2291, receiveProcedure=2402, sendProcedure=2403,
typmodinProcedure=0, typmodoutProcedure=0, analyzeProcedure=0, elementType=0, isImplicitArray=false, arrayType=16393,
baseType=0, defaultTypeValue=0x0, defaultTypeBin=0x0, passedByValue=false, alignment=100 'd', storage=120 'x',
typeMod=-1, typNDims=0, typeNotNull=false, typeCollation=0) at pg_type.c:484
484 CatalogTupleInsert(pg_type_desc, tup);
(gdb)

This forces gdb to jump to stack number 3, which is at pg_type.c:484. In here, you can examine all other variables in this frame (in function TypeCreate).

5.2 The p (Print) command

The most popular command in gdb, which can be used to print variable addresses and values

(gdb) p tup
$1 = (HeapTuple) 0x55ba8290f778
(gdb) p pg_type_desc
$2 = (Relation) 0x7f872f532228

(gdb) p * tup
$3 = {t_len = 176, t_self = {ip_blkid = {bi_hi = 65535, bi_lo = 65535}, ip_posid = 0}, t_tableOid = 0,
t_data = 0x55ba8290f790}

(gdb) p * pg_type_desc
$4 = {rd_node = {spcNode = 1663, dbNode = 16384, relNode = 1247}, rd_smgr = 0x55ba828e2a38, rd_refcnt = 2, rd_backend = -1,
rd_islocaltemp = false, rd_isnailed = true, rd_isvalid = true, rd_indexvalid = true, rd_statvalid = false,
rd_createSubid = 0, rd_newRelfilenodeSubid = 0, rd_firstRelfilenodeSubid = 0, rd_droppedSubid = 0,
rd_rel = 0x7f872f532438, rd_att = 0x7f872f532548, rd_id = 1247, rd_lockInfo = {lockRelId = {relId = 1247, dbId = 16384}},
rd_rules = 0x0, rd_rulescxt = 0x0, trigdesc = 0x0, rd_rsdesc = 0x0, rd_fkeylist = 0x0, rd_fkeyvalid = false,
rd_partkey = 0x0, rd_partkeycxt = 0x0, rd_partdesc = 0x0, rd_pdcxt = 0x0, rd_partcheck = 0x0, rd_partcheckvalid = false,
rd_partcheckcxt = 0x0, rd_indexlist = 0x7f872f477d00, rd_pkindex = 0, rd_replidindex = 0, rd_statlist = 0x0,
rd_indexattr = 0x0, rd_keyattr = 0x0, rd_pkattr = 0x0, rd_idattr = 0x0, rd_pubactions = 0x0, rd_options = 0x0,
rd_amhandler = 0, rd_tableam = 0x55ba82562c20 <heapam_methods>, rd_index = 0x0, rd_indextuple = 0x0, rd_indexcxt = 0x0,
rd_indam = 0x0, rd_opfamily = 0x0, rd_opcintype = 0x0, rd_support = 0x0, rd_supportinfo = 0x0, rd_indoption = 0x0,
rd_indexprs = 0x0, rd_indpred = 0x0, rd_exclops = 0x0, rd_exclprocs = 0x0, rd_exclstrats = 0x0, rd_indcollation = 0x0,
rd_opcoptions = 0x0, rd_amcache = 0x0, rd_fdwroutine = 0x0, rd_toastoid = 0, pgstat_info = 0x55ba828d5cb0}
(gdb)

With the asteroid, you can tell the p command to either print the address of a pointer or the values pointed by the pointer.

5.3 The x (examine) command

The x command is used to examine a memory block contents with specified size and format. The following example tries to examine the t_data values inside a HeapTuple structure. Note that we first print the *tup pointer to learn the size of t_data is 176, then we use the x command to examine the first 176 bytes pointed by t_data

(gdb)  p *tup
$6 = {t_len = 176, t_self = {ip_blkid = {bi_hi = 65535, bi_lo = 65535}, ip_posid = 0}, t_tableOid = 0,
t_data = 0x55ba8290f790}

(gdb) p tup->t_data
$7 = (HeapTupleHeader) 0x55ba8290f790
(gdb) x/176bx tup->t_data
0x55ba8290f790: 0xc0 0x02 0x00 0x00 0xff 0xff 0xff 0xff
0x55ba8290f798: 0x47 0x00 0x00 0x00 0xff 0xff 0xff 0xff
0x55ba8290f7a0: 0x00 0x00 0x1f 0x00 0x01 0x00 0x20 0xff
0x55ba8290f7a8: 0xff 0xff 0x0f 0x00 0x00 0x00 0x00 0x00
0x55ba8290f7b0: 0x0a 0x40 0x00 0x00 0x74 0x65 0x73 0x74
0x55ba8290f7b8: 0x00 0x00 0x00 0x00 0x00 0x00 0x00 0x00
0x55ba8290f7c0: 0x00 0x00 0x00 0x00 0x00 0x00 0x00 0x00
0x55ba8290f7c8: 0x00 0x00 0x00 0x00 0x00 0x00 0x00 0x00
0x55ba8290f7d0: 0x00 0x00 0x00 0x00 0x00 0x00 0x00 0x00
0x55ba8290f7d8: 0x00 0x00 0x00 0x00 0x00 0x00 0x00 0x00
0x55ba8290f7e0: 0x00 0x00 0x00 0x00 0x00 0x00 0x00 0x00
0x55ba8290f7e8: 0x00 0x00 0x00 0x00 0x00 0x00 0x00 0x00
0x55ba8290f7f0: 0x00 0x00 0x00 0x00 0x98 0x08 0x00 0x00
0x55ba8290f7f8: 0x01 0x40 0x00 0x00 0xff 0xff 0x00 0x63
0x55ba8290f800: 0x43 0x00 0x01 0x2c 0x08 0x40 0x00 0x00
0x55ba8290f808: 0x00 0x00 0x00 0x00 0x09 0x40 0x00 0x00
0x55ba8290f810: 0xf2 0x08 0x00 0x00 0xf3 0x08 0x00 0x00
0x55ba8290f818: 0x62 0x09 0x00 0x00 0x63 0x09 0x00 0x00
0x55ba8290f820: 0x00 0x00 0x00 0x00 0x00 0x00 0x00 0x00
0x55ba8290f828: 0x00 0x00 0x00 0x00 0x64 0x78 0x00 0x00
0x55ba8290f830: 0x00 0x00 0x00 0x00 0xff 0xff 0xff 0xff
0x55ba8290f838: 0x00 0x00 0x00 0x00 0x00 0x00 0x00 0x00
(gdb)

7. Conclusion

In this blog, we have discussed about how to generate a useful crash dump file with sufficient debug symbols to help developers troubleshoot a crash issue in PostgreSQL and also in other applications. We have also discussed about a very powerful and useful debugger gdb and shared some of the most common commands that can be utilized to troubleshoot a crash issue from a core file. I hope the information here can help some developers out there to troubleshoot issues better.

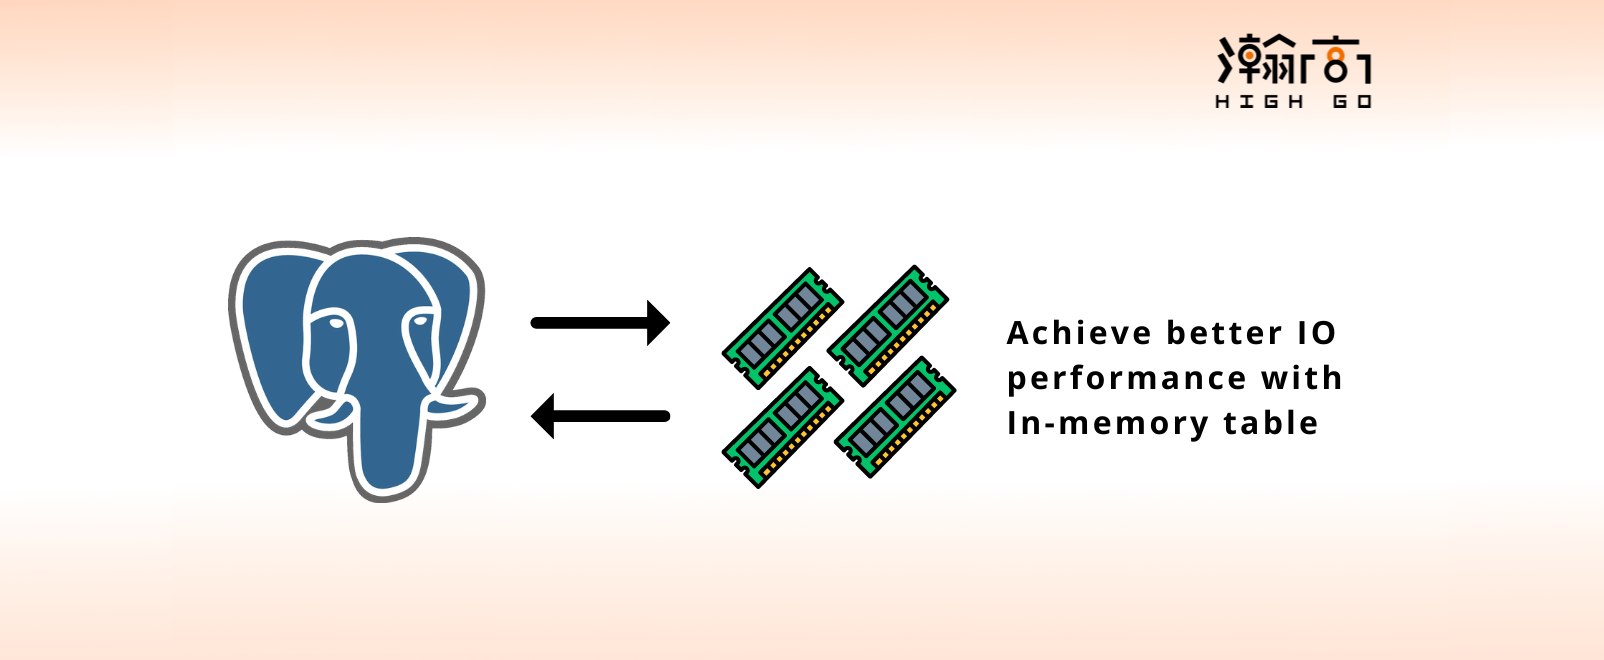
In-Memory Table with Pluggable Storage API

1. Introduction

This blog is to follow up on the post I published back in July, 2020 about achieving an in-memory table storage using PostgreSQL’s pluggable storage API. In the past few months, my team and I have made some progress and did a few POC patches to prove some of the unknowns and hypothesis and today I would like to share our progress.

2. The PostgreSQL Buffer Manager

In the previous post, I mentioned that we would like to build a new in-memory based storage that is based on the existing buffer manager and its related component and hooked it up with the pluggable storage API. To achieve this, my team and I underwent an in-depth study to understand how the current buffer manager works in PostgreSQL and this chapter at interdb.jp is a good starting point for us to gain a general understanding of the buffer manager design in good details.

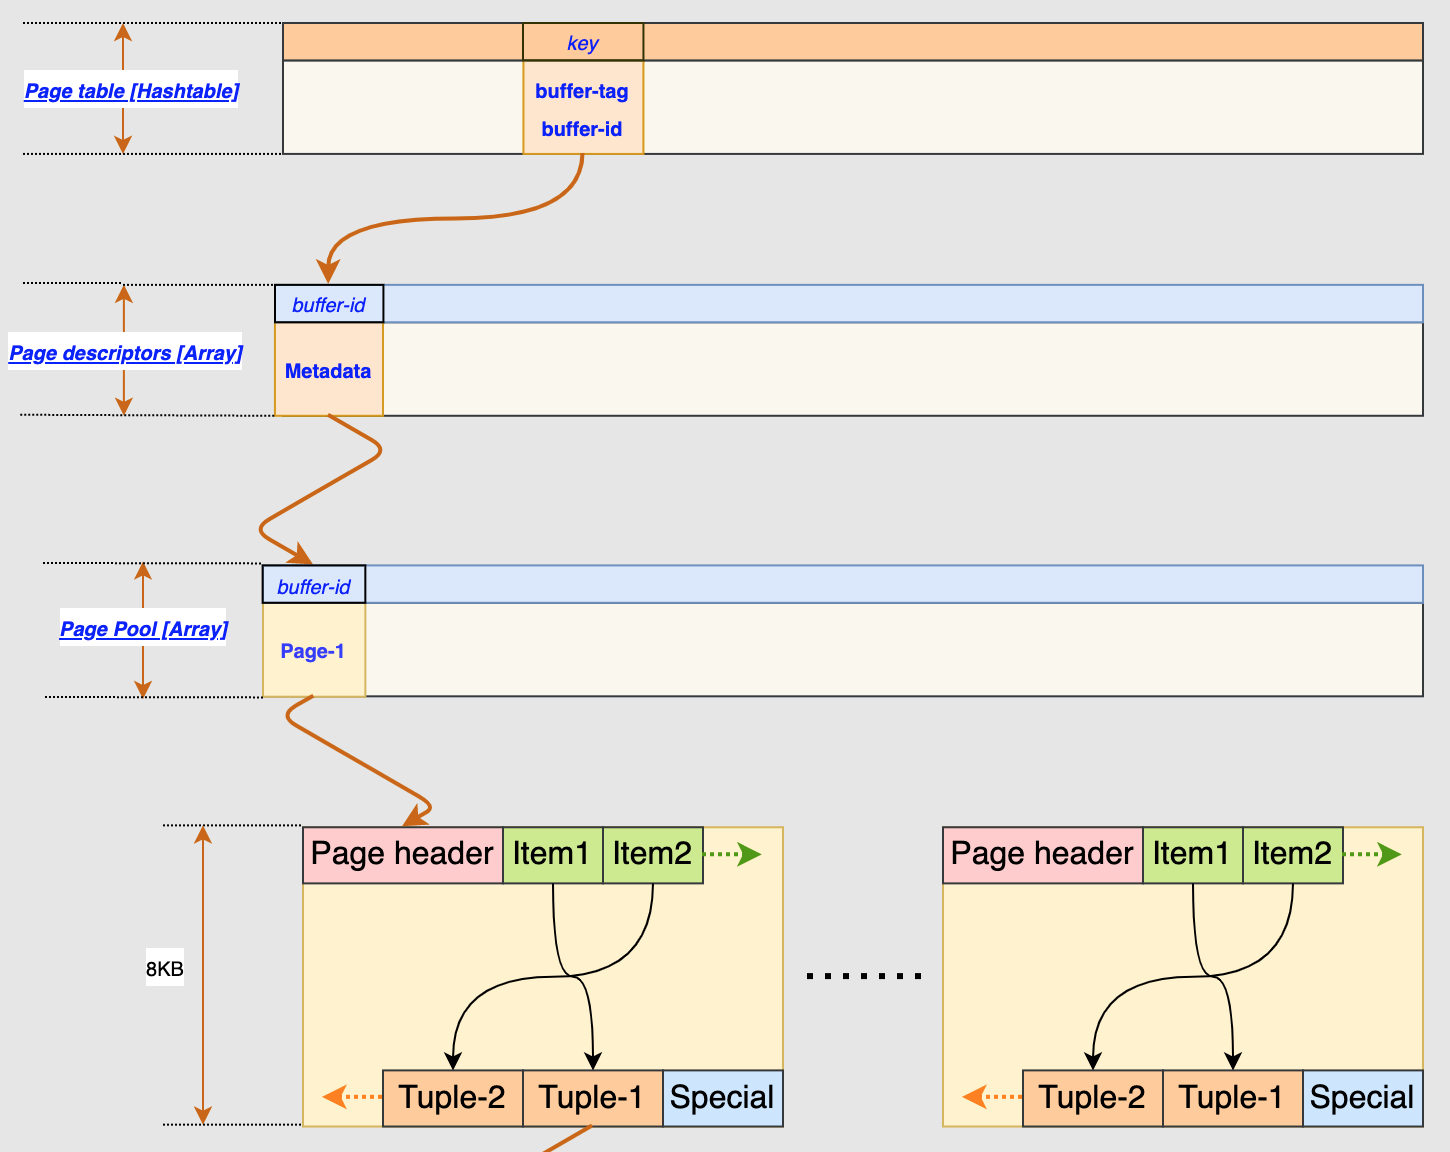
The current PostgreSQL buffer manager follows a 3-layer buffer design to manage the data pages as illustrated by this image below:

bufmgr

where it consists of

  • Buffer Table (hash table)
  • Buffer Descriptors (Array)
  • Buffer Pool (Array)

2.1 Page Table

Buffer Table is used like a routing table between PostgreSQL Core and the buffer manager. It is managed using the existing hash table utilities and uses buffer_tag to look up the page descriptor and buffer id. Buffer_tag is a structure that contains the table space, database, table name.

2.2 Buffer Descriptor

Buffer Descriptor is used to store the status of a buffer block and also the content lock. Refcount is a part of the buffer state, will be used to indicate the insert and delete operation. it will be increased by one when there is an insertion, and decreased by one when there is a deletion. The Vacuum process will reclaim this page once refcount reaches to 0.

2.3 Buffer Pool

Buffer Pool has a one to one relationship with buffer descriptor. it can be treated a simple pointer pointing to the beginning of the buffer pool, each buffer pool slot is defined as 8KB for now. This is the lowest layer in the buffer manager structure before a page is flushed to disk. The BM_DIRTY status flag is used to indicate if a page in the buffer pool is to be flushed to disk

In addition to buffer pool, buffer manager also utilizes a ring buffer for reading and writing a huge table whose size exceeds 1/4 of the buffer pool size. Clock Sweep algorithm is used to find a victim page in the ring buffer to eject and flush to disk so new page can enter, thus the name, ring buffer.

3. The In-Memory Only Buffer Manager

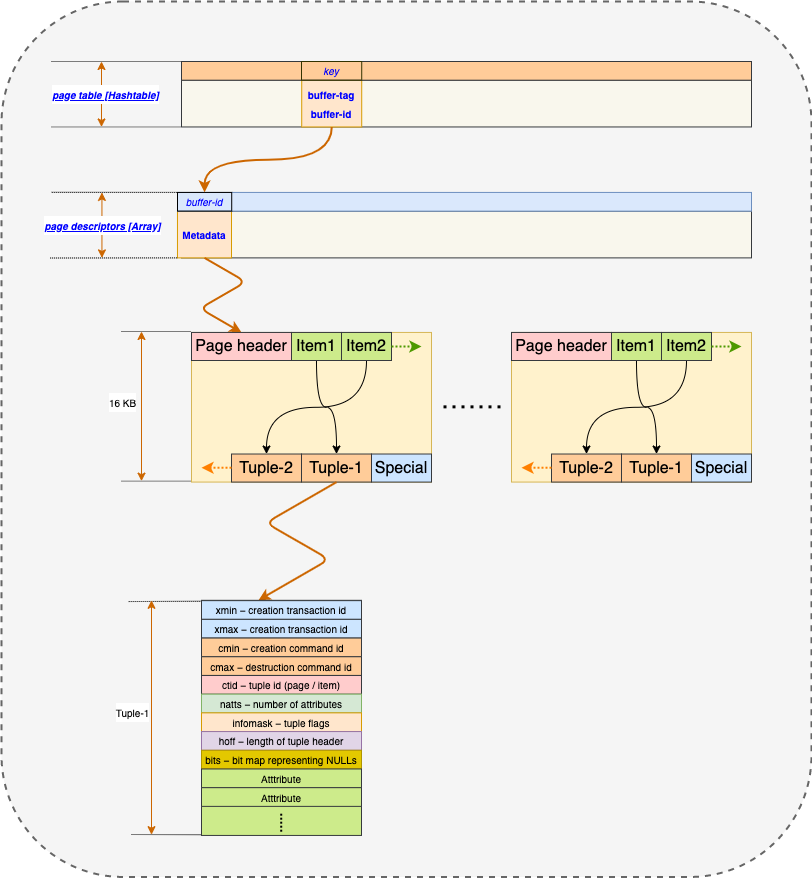
Having a general understanding of the existing buffer manager’s strucutre, we hypothesize that we could potentially improve its IO performance by eliminating the need to flush any buffer data to disk. This means that the in-memory only version of buffer manager itself is the storage media. For this reason, its strucutre can be simplified as:

bufmgr

where the buffer descriptor points to a dedicated memory storage that contains the actual page and tuple. This memory space can be allocated to a certain size at initlaization and there will not be a need to flush a page to disk. All data page and tuple will reside in this memory space. In the case where there is a huge reading and writing load, the ring buffer will not be allocated as the logic to find a victim page to evict and flush to disk will be removed since everything will reside in a dedicated memory space. For this reason, if the memory space is not sufficiently allocated, the user will get “no unpin buffer” is available, which basically means “your disk is full” and you need to do delete and vacuum.

Using this approach, when the server shuts down or restarts, the data in this memory space is of course lost. So, data persistence to disk would be a topic of interest next, but right now, we already see some useful business case with this in-memory based table where data processing speed is more important than data persistence

4. Initial Results

Using the same tuple structure and logic as the current heap plus the memory based buffer manager with 1GB of memory allocated, we observe some interesting increase in performance comparing to PostgreSQL with default settings. For 20 million row, we observe about 50% increase for insert, 70% increase for update, 60% increase for delete and 30% increase in vacuum. This result is not too bad considering we are still at the early stages and I am sure there are many other ways to make it even faster

5. Next Step

Having some solid results from the initial test, it would make sense for us to also be looking into having the index tuples as in-memory storage only. In addition, free space map and visibility map files that are stored in the PG cluster directory could potentially also be made as in-memory to possibly further increase the DML performance.

TLS Related Updates in PostgreSQL 13

1. Introduction

The upcoming major release of PostgreSQL 13 has several important behavioral updates related to the TLS implementation. These updates may have some to your current PostgreSQL security deployment if you were considering to upgrade to 13 when it officially releases. Today I would like to do a quick summary of these updates.

2. Minimum TLS Version Changed to TLSv1.2

There are 2 server parameters in postgresql.conf that influence the desired TLS versions to use during communication, ssl_min_protocol_version and ssl_max_protocol_version. In previous PG versions, the default value for ssl_min_protocol_version was TLSv1, in which many older versions of OpenSSL could support. In PG13, this default has been raised to TLSv1.2, which satisfies current industry’s best practice. This means that if your psql client is built using older version of OpenSSL, such as 1.0.0., the PG13 server by default will deny this TLS connection, until either you rebuild the psql client with newer version of OpenSSL, or you lower the ssl_min_protocol_version back to TLSv1. Lowering this default is strongly discouraged as older versions of TLS are not as secured and many industrial applications are communicating using TLSv1.2 as a standard requirement now.

3. New libpq connection parameters

There are also several updates to the libpq client side connection parameters related to TLS. See sub sections below:

3.1 ssl_min_protocol_version and ssl_max_protocol_version

The ssl_min_protocol_version and ssl_max_protocol_version parameters defined in the postgresql.conf on the server side were not available in the libpq client side in the previous PG versions. This means that in previous versions, it was not possible for client to influence the desired version of TLS to used as it would always want to used the newest TLS versions to communicate with the server. This may not be ideal in some cases. In PG13, the same sets of parameters are added to the libpq client side as well such that the client can also play a part in determining the ideal TLS version for communication. These parameters can be specified to psql like so:

psql -U user -d "sslmode=require dbname=postgres ssl_max_protocol_version=TLSv1.2"
psql -U user -d "sslmode=require dbname=postgres ssl_min_protocol_version=TLSv1.3"

The second command in the above example sets minimum TLS protocol to TLSv1.3, which means that this client would only want to communicate with a server that could support TLSv1.3 as minimum version requirement. TLSv1.3 is fairly new and not every PostgreSQL servers are built with this support. In this case, the client simply refuses to communicate. These parameters are great additions to the current libpq as they give the client the ability to enforce the desired TLS version to use rather than simply letting the server to decide, resulting in a much more secured environment.

3.2 channel_binding

Channel binding is a new feature introduced in PG13, in which the libpq client can optionally enable to further increase the security of the TLS connection. The channel_binding parameter can be set to require to enforce the channel binding feature, prefer to only use channel binding if it is available or disable to not use channel binding at all. prefer is the default value for the new channel_binding parameter.

The channel binding feature enforces trust between client and server so that Client informs the server whom it thinks it speaks to, and Server validates whether it is correct or not. This prevents an attacker who is able to capture users’ authentication credentials (e.g. OAuth tokens, session identifiers, etc) from reusing those credentials in another TLS sessions. In PG13, the channel binding is done by tying the user’s scram-sha-256 credentials to a unique fingerprint of the TLS session in which they are used (channel binding), so they cannot be reused in another TLS sessions initiated by the attacker.

To use this feature, we need to define a rule in pg_hba.conf that uses scram-sha-256 as authentication method. Ex:

hostssl    all    all    127.0.0.1/32    scram-sha-256

also set the default password authentication method to scram-sha-256 in postgresql.conf.

password_encryption = scram-sha-256

and then sets a scram-sha-256 password for the current user or another user in a existing psql connection

\password

or \password [username]

then finally, we can use psql with channel binding to connect to the server. Ex:

psql -U user -d "sslmode=require dbname=postgres channel_binding=require ssl_min_protocol_version=TLSv1.2"

3.3 sslpassword

In previous version of PG, in a sslmode=verify-full case, the client will need to specify its X509 certificate, private key and CA cert to complete the entire TLS authentication. In the case where the private key supplied by the client is encrypted with a password, the psql will prompt the user to enter it before proceeding with the TLS authentication. The new sslpassword parameter allows the user to specify the password to the connection parameters without prompting the user to enter it. This is a useful addition, as the psql command could basically completes without having a human or a bot to enter the passphrase to unlock the private key. This parameter can be used like this:

psql -U user -d "sslmode=verify-full dbname=postgres sslrootcert=cacert.pem sslcert=client.pem sslkey=client.key sslpassword=mypass"

4. Remove support for OpenSSL 0.9.8 and 1.0.0

Another major change is that PG13 will refuse to be built with OpenSSL versions 1.0.0 and 0.9.8 as these are very old and are no longer considered secured in today’s standard. If you are still using these OpenSSL versions, you will need to upgrade to newer or recent versions to be compatible with PG13.

5. Conclusion

PG13 brings many exciting new features and enhancements to PostgreSQL and many of these new changes need to be carefully assessed for potential incompatibility with the previous PG versions. Today, our focus is mainly on new updates related to TLS, which may have behavioral impacts to the existing deployment and the way existing client and server communicates using TLS. For the full changes and potential incompatibilities, visit the official change log here

Your browser is out-of-date!

Update your browser to view this website correctly. Update my browser now

×