1. Introduction
I am working on a new PostgreSQL feature that redefines the way a tuple’s visibility status is determined. The feature is working very nicely until I start doing a large SELECT query, which triggers PostgreSQL to spawn multiple parallel workers to process the request. When this happens, the feature I am working on start to yield incorrect results. A good portion of the data tuples returned are missing because they are considered as invisible, while some portion of it remains visible. It immediately came to my attention that the new feature I am working on does not work in parallel worker mode and somehow I need to find a way to debug into a spawned parallel worker to examine how it is computing the visibility and what is missing inside.
In this blog, I would like to share with you how I use GDB to debug and trace into a new parallel worker spawned by Postmaster in order to fix the visibility issue.
2. GDB Basics
I wrote another blog previously that shows how to use GDB to trace and debug a PostgreSQL issues and share some of the most common commands that I use every day to resolve software issues. If you are new to GDB, I suggest giving this blog a read here
3. How and When does PG Spawn A New Parallel Worker
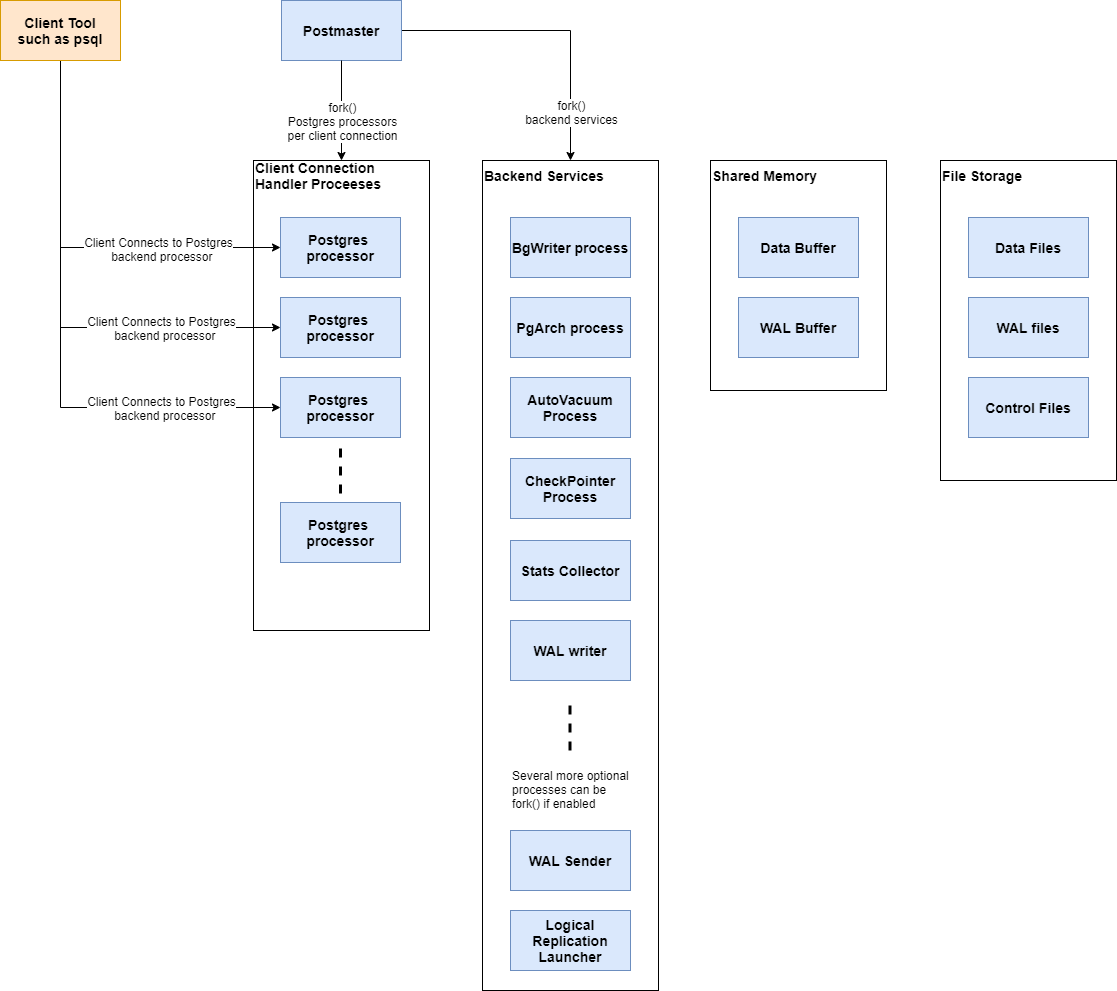
When you use psql to connect to a PostgreSQL database, it will spawn a new backend worker process to serve this connecting client. Most of the queries you provide will be processed by this backend process, includes SELECT, UPDATE, INSERT…etc. By default, if your SELECT query will require doing a sequential scan over 8MB of data, it will try to use a parallel worker to help speed up the processing. This 8MB threshold can be configured by the min_parallel_table_scan_size parameter in postgresql.conf . There is another configuration parameter max_parallel_workers that controls the maximum number of parallel workers is allowed to be spawned. The default is 8.
Technically, I can avoid my visibility issues simply by either setting min_parallel_table_scan_size to a huge number, or setting max_parallel_workers to 0. But this is really not my style, I would like to keep all these goodies that PG provides while being able to solve the problem.
To spawn a parallel worker, the psql backend will initialize a parallel worker context in the global process table and a message queue based on shared memory for communication with the backend. Then it sends a signal to postmaster to notify that the global process table has been updated.
When postmaster receives the signal, it will load the global process table and found that it needs to spawn a new parallel worker. It will proceed to fork a new parallel worker according to the context information supplied. This information determines the entry point for the parallel worker and what to do once spawned. During processing, the parallel worker and the psql backend use the message queue to communicate tuples back and forth and finally the psql backend will gather together all the data tuples and produce a final result back to the user.
4. Can We Use GDB to attach This Parallel Worker’s PID When Spawned?
Technically yes, but the life time of this parallel worker may be very short, by the time you see its PID from the ps -ef command, the worker may have already done its job and exited. This means, it is too late for me to start GDB and attach to its PID.
Instead, the technique I am going to show you today will trace the parallel worker from the moment it starts.
5. Tracing the Parallel Worker
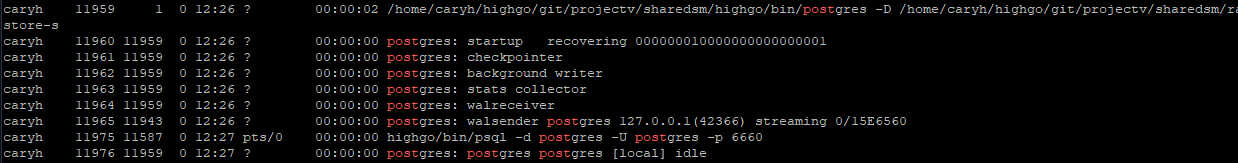
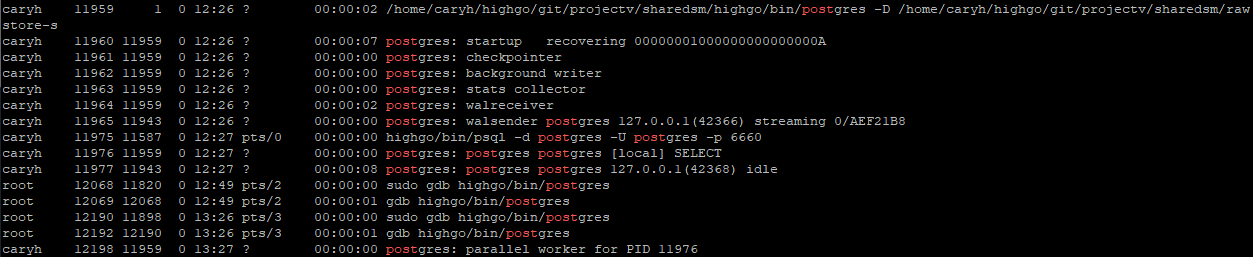
I will be using this instance of PostgreSQL server (version 12.5) as an example where PID 11976 is the psql backend process serving the psql client.
Pre-Condition:
Connect psql to the PostgreSQL server, create an example table and inserted about 2.5M rows of data. This will for sure trigger parallel workers.
$ psql -d postgres -U postgres -p 6660 |
Step 1: Attach GDB to the psql backend having PID = 11976 and Set a Break Point
I am setting a break point at the function RegisterDynamicBackgroundWorker. This is called when parallel worker is required to complete the query. Setting a breakpoint allows us more control as to when to proceed with a parallel worker spawn.
gdb postgres |
Step 2: Attach GDB to the Postmaster having PID = 11959 and Set 2 Break Points
We are using a second GDB to attach to the postmaster and set 2 break points there. fork_process is the function before postmaster actually spawns a new parallel worker using the system fork() call. ParallelWorkerMain is the main function for the parallel worker after it has been spawned.
gdb postgres |
Step 3: Execute a Large SELECT Query On psql To Trigger the Break Points
postgres=# select count(*) from test; |
The RegisterDynamicBackgroundWorker break point will be hit on the first GDB session having attached PID = 11959
Use the continue or c GDB command to continue to spawn the worker
Breakpoint 1, RegisterDynamicBackgroundWorker (worker=0x7ffd867f3c80, handle=0x55a009b77388) at bgworker.c:1002 |
As you continue the first GDB session, the second GDB session will pause due to receipt of a SIGUSR1 signal. This signal tells postmaster to reload the global process table and then spawn a parallel worker. Using the continue command will hit the first break point at fork_process
Program received signal SIGUSR1, User defined signal 1. |
Step 4: Tell Postmaster GDB To Follow Child Process Instead Of Parent
At this point, the postmaster GDB is now waiting at the fork_process call, which is right before spawning a parallel worker. This is a good time now to tell GDB to follow the child process instead of staying at parent when the process calls fork(). The reason we want to set this late at this moment is because postmaster is occasionally spawning other backend processes such as walsender and walreceiver. Setting to follow child process early may cause our GDB to follow to another backend process that we are not interested in.
(gdb) set follow-fork-mode child |
You may use the continue command after setting it to follow child. Then immediately the GDB will switch to the new child process having PID = 12198 below and hit our second break point ParallelWorkerMain. So, Now the GDB is debugging the parallel worker process instead of the original postmaster.
(gdb) c |
Step 5: Continue To Debug The Parallel Process
Using the ps -ef | grep postgres command, we can see a new parallel worker being spawned having PID = 12198
At this point, you are free to explore the process flow of the parallel worker. For me, I am debugging the visibility issues, so I will set additional break points at HeapTupleSatisfiesMVCC and TransactionIdIsCurrentTransactionId. In your case, you may be debugging some other functionalities.
Being able to debugging into a parallel worker with GDB allows me to see the problems I was having and being able to fix quickly.
If you are having trouble tracing into a parallel workers spawned by PostgreSQL during run time, I hope this blog will be helpful to you.